Monday, December 31, 2012

Display Shapefiles on Google Maps with this Google Mapplet

It would be nice to import and overlay ESRI Shapefiles over a Google Maps backdrop without having to upload the files to a web server. With the new HTML5 FileReader objects  implemented in modern browsers, it is now possible to do this. I burnt some midnight oil to write this tool to read, reproject to the Mercator coordinate system, and display Shapefiles as Google Maps overlays.

The following steps demonstrate how to use the tool.

  1. Use a modern browser (such as Chrome or FireFox) to open this page http://dominoc925-pages.appspot.com/mapplets/vshpfile.html.


  2. Click Import shapefile.

    The Import Shapefile dialog box appears.
  3. In the SHP field, click the Choose File button. Browse and select a Shapefile e.g. mgrs6x8_east.shp.


  4. In the DBF field, click the Choose File button. Browse and select the Shapefile's corresponding DBF file e.g. mgrs6x8_east.dbf.


  5. In the Coordinate system type field, choose the correct system for the Shapefile e.g. Geographic. If Projected is chosen, then choose the correct Projection.


  6. In the Geodetic Datum field, choose the correct datum e.g. WGS84.
  7. Click Start Import.

    If all goes well, the Shapefile will be displayed on the Google Maps backdrop. It might be necessary to zoom into the Shapefile's bounds by clicking the More commands | Fit shapefile buttons on the sidebar.


  8. Click on the Shapefile overlay to display the DBF attributes in an Info window.


  9. Repeat to display more Shapefiles. 

Monday, December 24, 2012

WebApp to show DBASE (*.dbf) file information

The ESRI Shapefile format stores database attributes in DBASE DBF (*.dbf) file and shape geometries in another associated file (*.shp). Using the DBASE file structure documentation in http://www.dbf2002.com/dbf-file-format.html, I wrote a simple Javascript web app to show basic information about a DBF file, similar to the open source ShapeLib's dbfinfo executable.

 The web app can be run from this page http://dominoc925-pages.appspot.com/webapp/dbf_info/default.html.

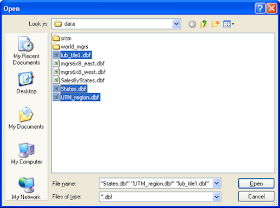
  1. To use the web app, simply drag and drop one or more DBASE files (*.dbf) into the dashed box as shown in the screenshot below.

  2. Or click the button and choose one or more (*.dbf) files. .


    Basic information about the DBF file is displayed, including the number of records, the number of columns, column names and type.


Note: This will run only on Chrome and a development version of FireFox that uses Gecko 7 at the moment. 

Monday, December 17, 2012

WebApp to show Shapefile information

I wrote a simple HTML5 Web App to show basic information about one or more ESRI Shapefile (*.shp) files similar to the shpinfo command from the open source ShapeLib library. The processing of the Shapefile is done in the local web browser without having to upload it to a server. The web app can be run from this web site http://dominoc925-pages.appspot.com/webapp/shpfile_info/default.html.

One the page is displayed, either click the button and select one or more Shapefiles or drag and drop *.shp files into the dashed box as shown in the screenshots below.


The Shapefile information is displayed in the web page.


Monday, December 10, 2012

Code snippet to check browser support for FileReader's readAsArrayBuffer method

The HTML5 FileReader object specifications provides for a few methods to read files including readAsBinaryString, readAsText, readAsDataURL and readAsArrayBuffer. Not all browsers have implemented all the methods. For instance, Chrome already has support for the readAsArrayBuffer method but FireFox will support the same method in future versions that uses Gecko 7.0. It would be wise to put in some checks in the Javascript code to detect whether the readAsArrayBuffer method is supported and take appropriate actions if it is not.

The following Javascript code snippet shows a simple example of detecting support for the FileReader  readAsArrayBuffer API.

if (window.FileReader && window.FileReader.prototype.readAsArrayBuffer) {
    alert('The FileReader APIs are supported');
} else {
    alert('The FileReader readAsArrayBuffer API is not supported');
}

Monday, December 3, 2012

Javascript class to read a binary file in a browser

I found this nice open source code at https://github.com/vjeux/jDataView that provides a class for reading binary files in the browser.

The following Javascript code snippet is a simple example I wrote showing how to parse through a binary file using the HTML5 FileReader and the jDataView class.

function onFileButtonChange(evt){
    var files = evt.target.files;
    var f = files[0];

    //create a new instance of the HTML5 FileReader
    var reader = new FileReader();    
    //onload is called when the binary file is loaded
    reader.onload = function(e){        
        //store the binary array buffer in the buff variable
        var buff = e.target.result;
        
        //create a new instance of the jDataView
        var dv = new jDataView(buff);
        
        var offset = 0;
        //read a little endian signed integer (4 bytes) from byte offset 0. 
        var field1 = dv.getInt32(offset,true);
        
        offset+= 4;    //Move to the next field
        //read a little endian double (8 bytes) from byte offset 4
        var field2 = dv.getFloat64(offset,true);
        //...etc...
    };
    //read in a binary file as an ArrayBuffer
    reader.readAsArrayBuffer(f);
}

Visit the project repository for more details about the jDataView class.

Note that the HTML5 FileReader object's readAsArrayBuffer method has only been implemented in Chrome and FireFox 7+ at this point in time.

Monday, November 26, 2012

Batch watermark images with this HTML5 web app

There are a few online web sites that can place watermarks on one or many images. However, in order to use those services, the images need to be uploaded to the web server before the water marking process can be done. The canvas element of HTML5 is a rich object for image processing and I used this element to write a web app to perform a similar water marking task locally using a modern browser like Chrome and Firefox or Internet Exporer 10+ without having to upload to a web server.

  1. To run this web app, go to http://dominoc925pages-appspot.com/webapp/watermark_image.html.


  2. Optional. Click Settings and change the Watermark text, font style, size, color, transparency, location, alignment, scale and other properties.
  3. Simply drag and drop the image files (JPEG, PNG, GIF) into the dashed box. Or click the Choose Files button and select one or more image files.


    The image(s) are watermarked.


  4. Just right click on the image and choose Save image as to save out the watermarked image.

Monday, November 19, 2012

GeoMedia C# code snippet to get the warehouse connection's table list

It is useful to programmatically retrieve the list of tables in a GeoMedia warehouse via the connection object. The GeoMedia MetadataService can be called upon to generate the list in a String array. The following C# code snippet shows how this can be done.

The connection object is passed in to the GetTableList method and returns an ArrayList of table names.

using GeoMedia = Intergraph.GeoMedia.GeoMedia;
using PCSS = Intergraph.GeoMedia.PCSS;
using PBasic = Intergraph.GeoMedia.PBasic;
using GDO = Intergraph.GeoMedia.GDO;
using PClient = Intergraph.GeoMedia.PClient;
using PService = Intergraph.GeoMedia.PService;
using GMService = Intergraph.GeoMedia.GMService;
//...etc...
private ArrayList GetTableList(PClient.Connection conn)
{
String[] list = null;
ArrayList tables = new ArrayList();
object oConn = (object)conn;
int mask = 0;
object vTables = null;
GMService.MetadataService metadataSvc = null;

//Create an instance of the GeoMedia MetadataService
metadataSvc = new GMService.MetadataService();
//Pass in the connection object to the MetadataService
metadataSvc.set_Connection(ref oConn);
//Get the connection's list of tables and put them into the vTables array
metadataSvc.GetTables(ref mask, ref vTables);

//copy the table list into an ArrayList and return to the calling function
list = (String [])vTables;
for (int i = 0; i < list.Length; i++)
tables.Add(list[i].ToUpper());
return tables;
}

Monday, November 12, 2012

Copy point database attributes to polygons in Global Mapper

A common task in GIS is to copy the attributes of points to the enclosing area polygons. It is simple to perform the task in Global Mapper as illustrated below.

  1. Start Global Mapper. Load a polygon layer and a point layer.

  2. Press ALT+D.

    The Digitizer tool is activated.
  3. Click and drag a rectangle around the polygons and points.

    The polygons and points are selected.
  4. Press the mouse right button anywhere in the map view.

    A pop up menu appears.
  5. Select Attribute Functions | Add attributes to Selected Areas from Points.

    The following message appear.
  6. Click Yes. Then click OK.

    The point attributes are copied to the polygons.

Monday, November 5, 2012

2-D equations to transform between world and local coordinate systems

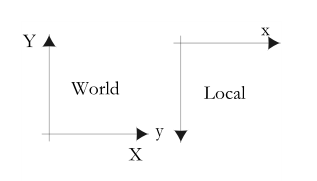
The geographic (world) coordinate systems e.g. UTM typically have the positive Y-axis pointing upwards and the X-axis pointing eastward. Local coordinate systems such as the HTML5 or SVG canvas have the positive Y-axis pointing downwards. The figure below shows the differences between the world and local coordinate systems.

I found it useful to work out the 2-D equations to transform coordinates between the world and the local coordinate systems for encoding into software programming functions.

A simple non-matrix example is show below.

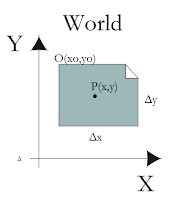
In the figure below, an image file has the origin O with the world coordinates (x0,y0) and dimensions of Δx and Δy. 

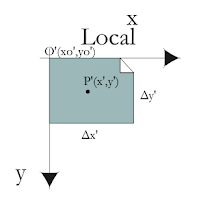
The corresponding image file in the local coordinate system has the origin O'(x0',y0') and dimensions of Δx' and Δy'. Typically (x0',y0') = (0,0). 


A point P(x,y) in the world coordinate system can be transformed to a point P'(x',y') in the local coordinate system with the following equations:
x' = (x - x0) * Sx
y' = -(y - y0) * Sy


where 
Sx = Δx'/Δx
Sy = Δy'/Δy


A point P'(x',y') in the local coordinate system can be transformed to a point P(x,y) in the world coordinate system with the following equations:
x = (x'/Sx) + x0
y = -(y'/Sy) + y0

Monday, October 29, 2012

Add coordinate attributes to points in Global Mapper

Sometimes for whatever reason it is useful to convert the point geometry X and Y vertices as database attributes so that they can be manipulated just like any other database attributes. It is simple to do this in Global Mapper. This is illustrated in the example below.

  1. Start Global Mapper. Load in a point geometry layer.

  2. Optional. Select Tools | Feature Info. Click on any point.

    The Feature Information dialog box appears.

    Note: there are no database attribute fields for the vertices.
  3. Select Tools | Digitizer.

    The digitizer tool is activated and the cursor becomes a cross-hair with the label EDIT.
  4. Click and drag a rectangle to select one or more points.

    The selected points are highlighted in red.


  5. Press the mouse right button.

    A pop up menu appears.

  6. Choose Attribute Functions | Add coordinate attributes to selected points.

    The X,Y coordinates are added to the point attributes. A message box appears.


  7. Close the message box.
  8. Optional. Select Tools | Feature Info. Click on one of the points.

    The Feature Information dialog box appears.

    Note: the X,Y coordinate attribute fields are now displayed.

Monday, October 22, 2012

A faster alternative to the Android SDK Emulator to test apps

If you have done any development for the Android platform, then you would probably have found the Android SDK emulator to be very slow sometimes for the newer Android OS versions - Ice Cream Sandwich or Jelly Bean, especially if no snapshot is used. Recently, AMD and BlueStacks released the BlueStacks Android Player that can run Android apps on Windows. It can be downloaded from http://bluestacks.com/.

The player can run apps at a more reasonable speed than the emulator on my aging notebook. Since it runs faster, I spend less time waiting and therefore it gives me better productivity in testing my Android apps. On the other hand, you cannot step through your Android code interactively and debug your Android application. To do that, you still have to use the Eclipse IDE and the Android SDK's emulator or an actual physical Android handset.

The following screenshots show how an Android APK file can be installed into the BlueStacks Android Player.
  1. First, start up the BlueStacks Player by selecting Start | All Programs | BlueStacks | Start BlueStacks.

    The AMD AppZone Player, Powered by BlueStacks application appears.
  2. Use the Windows Explorer and browse to the folder containing an Android APK file.

  3. Double click on it.

    The Android app is installed into the BlueStacks Player.
  4. If you don't see it in the player, then click the My Apps icon.

Monday, October 15, 2012

Merge LiDAR LAS files using FME

If you want to merge multiple LiDAR LAS files into a single, combined file, then it is possible to use the Safe FME Workbench to quickly put together a simple workflow to do the job. All that is required is to define a Reader for the multiple LAS files, connect that to the PointCloudCombiner transformer and output to a LAS file Writer. The following illustrates the steps.

  1. Start the FME Workbench.
  2. Select Readers | Add Reader.

    The Add Reader dialog box appears.

  3. In the Format field, choose ASPRS Lidar Data Exchange Format (LAS).
  4. In the Dataset field, click the browse [...] button. Select two or more LAS files. Click OK.

    The Reader is added to the Main pane.
  5. From the Transformer Gallery pane, drag and drop the PointCloudCombiner transformer onto the Main pane.
  6. Select Writers | Add Writer.

    The Add Writer dialog box appears.

  7. In the Format field, choose ASPRS Lidar Data Exchange Format (LAS).
  8. In the Dataset field, click the browse [...] button and define the output folder.
  9. Click OK.

    The following prompts will appear. Click Yes and OK.


  10. Connect the Reader, transformer and Writer as shown.


  11. Run the translation.

    The LAS files are merged into a single file.

Monday, October 8, 2012

Calculate the difference between ground control points and a DEM using Global Mapper

Somebody asked me how to find out the elevation difference between the digital elevation model (DEM) and independently surveyed ground control points (GCP). Any terrain software such as Global Mapper should have the tools to calculate the differences. In this post, I shall illustrate the steps to use Global Mapper to find out the elevation differences.

It is not as straightforward as other software as there is no single tool in Global Mapper. Basically, the DEM and the ground control points layer must be loaded together first; then the DEM elevation under the control point must be added to the GCP layer as an ELEVATION database attribute field. With the database attributes having the GCP elevation and DEM elevation fields, a database field subtraction can be done to calculate the difference between the DEM elevation and the GCP elevation.

Load the DEM and GCPs

  1. Start Global Mapper. Load in a DEM layer e.g. dtm.asc.


  2. Load and display the vector GCP layer e.g. gcp.shp.

  3. Optional. Select Search | Search by Attributes, Names, and Description.

    The Search by Attributes, Names, and Description dialog box appears.

    Note the GCP elevation field e.g. GPS_ELEVAT

Append the DEM elevation to the GCP
  1. Select File | Export Vector Format.

    The Select Export Format dialog box appears.
  2. Choose a format e.g. Shapefile. Click OK.

    The Shapefile Export Options dialog box appears.
  3. Toggle on Generate 3D Features Using Loaded Elevation data.
  4. Toggle on Export Points.

    The Save As dialog box appears.
  5. Type in the new GCP layer name e.g. gcp_dsm_accuracy.shp. Click Save.


    The GCP layer is exported out to a new vector file. The DEM elevation for each GCP point is appended to the output file
    .
  6. Press ALT+C.

    The Overlay Control Center dialog box appears.
  7. Select the loaded GCP layer e.g. gcp.shp. Click Close Overlay.

    The GCP layer is unloaded
    .

Calculate the difference between GCP and DEM elevations
  1. Load in the GCP layer appended with the DEM elevations exported previously e.g. gcp_dsm_accuracy.shp.

  2. Press ALT_C.

    The Overlay Control Center appears.

  3. Right click on the GCP layer.

    A pop up menu appears.

  4. Choose CALC_ATTR.

    The Setup Attribute Calculation dialog box appears.
  5. In the Select Existing or Create New Attribute to Assign Calculated Values to field, type in a name e.g. hgtdiff.
  6. In the Source Attribute field, choose the GCP elevation field, e.g GPS_ELEVAT.
  7. In the Operation field, choose Subtract.
  8. Toggle on Use Attribute Value. Choose the DEM elevation field e.g. ELEVATION.


  9. Click OK.

    The differences are calculated and inserted into the hgtdiff field.


    The Feature Information dialog box below shows the new field with the calculated difference for one of the GCP feature.