Monday, December 27, 2010

Standard terrain analysis in SAGA GIS

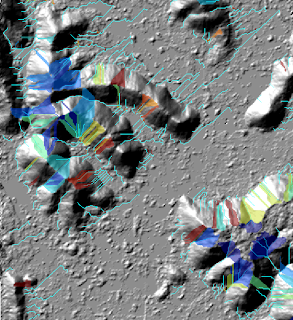
SAGA GIS has a convenient module to perform a number of standard terrain analysis functions at one go - the Standard Terrain Analysis module. It generates a number of grid layers of terrain related data including the slope, aspect, curvature, hill shading, and watershed basins among other layers, and a single vector layer of the watershed channel network. An example screenshot is shown below.


To use this module, a digital elevation model (DEM) file such as a SDTS file must be loaded into SAGA GIS and used as the source layer for the command.

Loading a DEM file

  1. Start up SAGA GIS.
  2. Select Modules | File | GDAL/OGR | GDAL : Import Raster.

    The GDAL: Import Raster dialog box appears.
  3. Select the Files row and click the browse button. In the Open dialog box that appears, choose a DEM file e.g. 9894CATD.DDF. Click Open.

    The selected file name is displayed in the Files field.
  4. Click Okay.

    The DEM file is loaded.
Performing the standard terrain analysis
  1. Select Modules | Terrain Analysis | Standard Terrain Analysis.

    The Standard Terrain Analysis dialog box appears.
  2. Select the Grid system row. Choose the previously loaded DEM layer's system, e.g. 30;384x 464y; 545765x 3831410y.
  3. Select the Elevation row. Choose the previously loaded DEM layer's name, e.g. 01.9894CATD.


  4. Click Okay.

    The standard terrain analysis is performed on the input DEM layer and the output grid and vector layers are created.

Viewing some of the resultant layers
  1. In the Workspace pane's Data tab, double click on a few layers e.g. 03.Analytical Hillshading, 18.Watershed Subbasins, 01. Channel Network.

    The Add layer to selected map dialog box appears.
  2. In the Map Selection list box, choose the same map for all layers so that they will overlay on each other. Click OK.

    The layers are displayed in the same map window.

Monday, December 20, 2010

How to obtain the Google Maps API key for Android

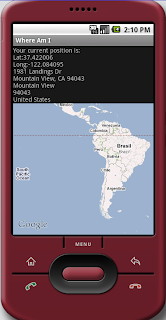
If you are developing on Windows with Eclipse, an API key needs to be obtained from Google if you want to embed Google's MapView control in your custom Android mobile phone app. An example application is shown in the figure below.

Assuming the preferences for the Eclipse development platform have not been changed from the default values, then following steps can be used.

Generate the Certificate Fingerprint 
  1. On Windows, open up a Command Prompt.
  2. In the Command Prompt window, use the cd command to change to the .android subdirectory underneath your "home" directory, e.g. C:\Documents and Settings\xxxx\ where xxxx is your user name.

    C:\> cd "\Documents and Settings\xxxx\.android"
  3. Type in the following keytool command.

    C:\> keytool -list -keystore debug.keystore

    Note: if the system PATH is not set with the Java Development Kit's bin folder, then the full path to the keytool executable in the JDK/bin/ directory need to be used. For example,

    C:\> "\Program Files\jdk1.6.0_18\bin\keytool -list -keystore debug.keystore

    The following prompt is displayed.

    Enter keystore password:
  4. Type in a password, e.g. android.

    The following information may be displayed.
    Keystore type: JKS
    Keystore provider: SUN

    Your keystore contains 1 entry

    androiddebugkey, Feb 2, 2010, PrivateKeyEntry,
    Certificate fingerprint (MD5): 94:1E:43:49:87:73:BB:E6:A6:88:D7:20:F1:8E:B5:98
  5. Note down the certificate fingerprint, e.g.  94:1E:43:49:87:73:BB:E6:A6:88:D7:20:F1:8E:B5:98.
Generate the API key
  1. Click this link to http://code.google.com/intl/ja/android/maps-api-signup.html
  2. Type in or paste the certificate fingerprint, accept the terms and conditions and click Generate API Key.

    The API key is generated.
  3. Copy this API key and use it in any Android layout.xml file that uses the MapView control.
An example layout.xml file is shown below:

<?xml version="1.0" encoding="utf-8"?>
<LinearLayout
  xmlns:android="http://schemas.android.com/apk/res/android"
  android:layout_height="fill_parent" android:layout_width="fill_parent" android:orientation="vertical">
  <com.google.android.maps.MapView
   android:id="@+id/map_view"
   android:layout_width="fill_parent"
   android:layout_height="fill_parent"
   android:enabled="true"
   android:clickable="true"
   android:apiKey="0Prelr1y0-DbJXwq7tIfLRwDLWTZb-MJA76FtYw"
  />
</LinearLayout>

Monday, December 13, 2010

Global Mapper's Add/Update Measurement attributes to line/polygon features

Calculating the linear or polygon geometry's measurement attributes such as length, perimeter or area can be done easily Global Mapper's Add/Update the Measure Attributes of Selected Features command. If the feature does not have the measurement attribute fields - Length, Perimeter or Enclosed Area, then the command will append them to the feature. Otherwise, the command will update the fields with the recalculated measurement values.
  1. Start up Global Mapper and open up a vector linear or polygon feature file.


  2. Click the Digitizer Tool .

    The cursor changes to a cross-hair with the Edit label.
  3. Using the mouse, click and drag to select one or more features.

    The features are selected.

  4. Press the mouse right button anywhere in the map display.

    A pop up menu appears.
  5. Choose Add/Update the Measure Attributes of Selected Feature(s).

    The selected features are updated and a message appears.
  6. Click OK.
To review the measure attributes of a feature, press ALT+P and click on any feature. This will bring up a Feature Information dialog box as shown below. Note the measure attribute fields Length.

Monday, December 6, 2010

Export a GeoMedia Access Warehouse to Postgis with GM2PGSQL

If you have been using Postgis for a while, you would be familiar with the shp2pgsql executable. This executable converts a shapefile into a Postgis SQL file for bulk loading into a Postgis database. There is a similar executable for converting a GeoMedia Access warehouse into Postgis. It is gm2pgsql, a free executable which is downloadable from this web site http://gm2pgsql.projects.postgresql.org/.

To use this executable,
  1. Type in the gm2pgsql command at the Windows Command Prompt.

    For example, input.mdb is the source GeoMedia Access warehouse, output.sql is the destination Postgis SQL file, pgdatabase is the destination Postgis database schema name, and -1 is the SRID number.

    C:\> gm2pgsql input.mdb output.sql pgdatabase -1
  2. Press RETURN.

    All the supported features in the Access warehouse are exported out.
If you open up the resultant SQL file with Notepad, the SQL statements to create the corresponding Postgis tables and corresponding feature attributes and geometries can be seen, as shown below. 
It seems that there is no way to limit the export to a single feature table; it will export all features that it recognizes. For more details, please visit the gm2pgsql project page at http://gm2pgsql.projects.postgresql.org/.

Wednesday, December 1, 2010

Free LAS viewer - PointVue LE

I found this free 3-D LiDAR LAS file viewer PointVue LE from GeoCue Corp., which can be downloaded from this link.


The free viewer provides you the capability to view only a single LAS file at a time in 3-D. It allows you to color the LiDAR points according to elevation, intensity, classification, return number, and source id. It does not have the capability to render the LiDAR points as surfaces or as contours though. There is also no way to cut a cross-section profile view of the data.


It has some basic functions to display the LAS file header and generate some statistical information about the data as shown below.


If you are looking for a simple LAS file viewer with reasonable visualization performance, PointVue LE may be what just you are looking for.