PDAL can be used to generate a
GeoTIFF digital elevation model (DEM) from a LiDAR point cloud LAS file via the GDAL writer driver. The resultant elevation GeoTIFF file may not be displayed as what is expected in some software such as
Global Mapper because the PDAL generated file can have one or more bands of data including an alpha channel, depending on the PDAL options used; refer to
https://www.pdal.io/stages/writers.gdal.html for the types of output bands that can be written to the DEM GeoTIFF file. For normal display, it might be necessary to separate the bands into individual files - in this post, the
OTB (
Orfeo Tool Box)
otbcli_splitImage executable is used.
The following steps show how to generate a GeoTIFF DEM and split the resultant file into separate bands.
Generate the DEM
- Open up a text editor. Type in the following JSON text. Save the text into a file e.g. pdal_dtm.json
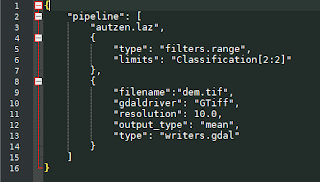
Note: the JSON pipeline text will do the following:
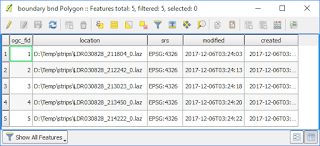
(a) Load in a LAS file e.g. autzen.laz
(b) Filter away non-ground classified point
(c) Write only the mean Z values to a GeoTIFF file dem.tif with a resolution of 10 meters
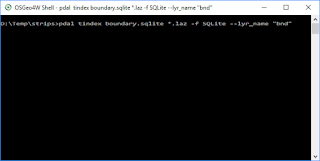
- Open up the OSGeo4W Command Prompt.
The Command Prompt appears.
- Type in the PDAL command to process the pipeline. Run the command.
C:\> pdal pipeline pdal_dtm.json
The GeoTIFF file dem.tif is generated.
Splitting the bands
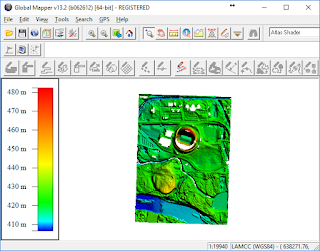
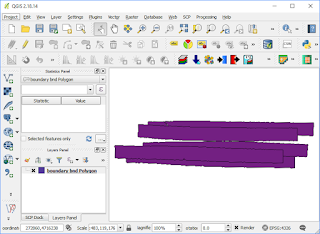
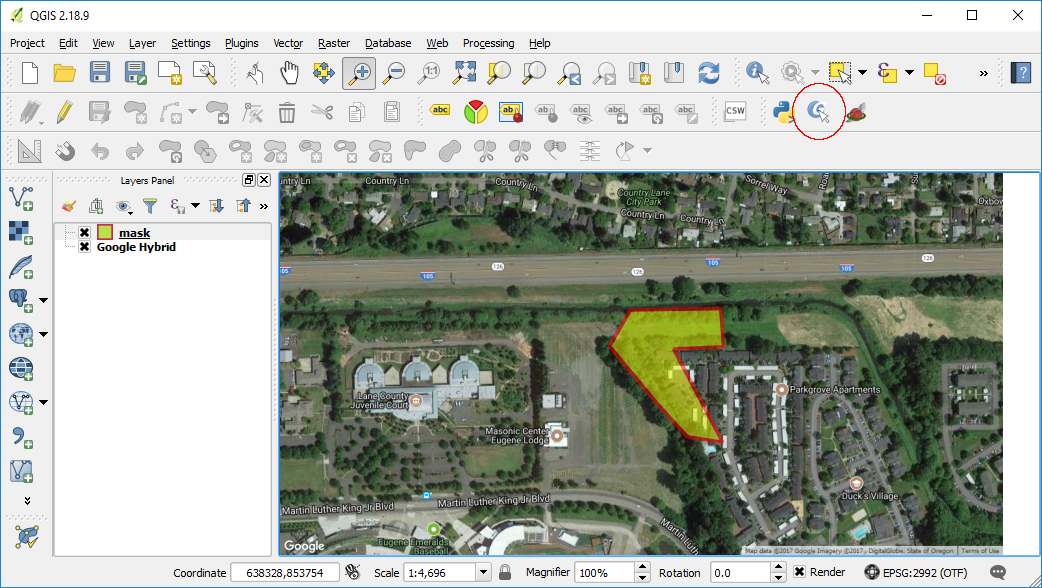
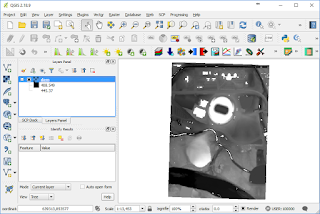
Displaying the resultant
dem.tif containing only the mean Z band in
QGIS will show something resembling a grayscale terrain with masked areas, as shown in the screenshot below.
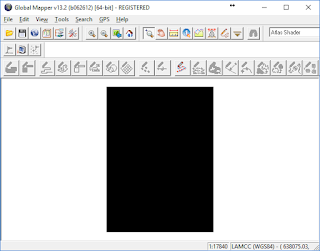
However, displaying the resultant GeoTIFF in
Global Mapper will show a black rectangle, as shown below, due to the presence of an alpha channel. This need to be removed for proper interpretation of the elevation data.
To split the bands, do the following:
- In the OSGeo4W Command Window, type in the command:
C:\> otbcli_splitimage -in dem.tif -out split.tif
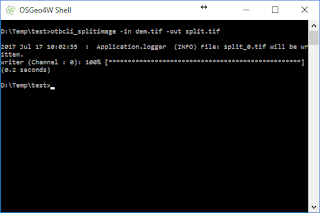
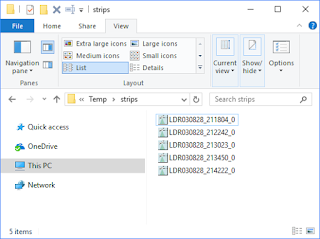
The input file dem.tif is split into separate files with a numbered suffix starting from 0 e.g. split_0.tif.
- Now, the file can be displayed properly in Global Mapper.