Monday, March 26, 2012

How to install Windows 8 Consumer Preview in VMWare Player

I downloaded the Windows 8 Consumer Preview 32 bit version iso file from the Microsoft web site http://windows.microsoft.com/en-US/windows-8/iso. It is possible to install the operating system inside the VMware Player 4 virtual machine environment. The player can be downloaded from this web site http://downloads.vmware.com/d/info/desktop_end_user_computing/vmware_player/4_0.

The following screen shots show the steps:

  1. Run the VMware Player.

     
  2. Click Create a New Virtual Machine.

    The New Virtual Machine Wizard dialog box appears.


  3. Toggle on Installer disc image file (iso). Click Browse. Select the iso file downloaded previously e.g. Windows8-ConsumerPreview-32bit-English.iso. Click Next.


  4. Toggle on Microsoft Windows. In the Version combo box, choose Windows 7. Click Next.


  5. In the Virtual machine name field, type in a text string e.g. Windows8.
  6. In the Location field, click Browse and specify the folder to contain the VMware virtual machine files e.g. V:\VM\Win8. Click Next.


  7. Optional. In the Maximum disk size field, type in the desired size to allocate for the VM e.g. 60.
  8. Click Next.


  9. Click Finish.


  10. Select the newly create virtual machine e.g. Windows8. Click Play virtual machine.

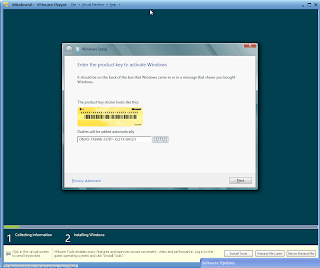
    The Windows 8 Setup Wizard appears.


  11. Follow the prompts to complete the installation.


    The Metro tiles appear!
     

Monday, March 19, 2012

Use the GeoMedia Math Service to get the range of any geometry object

It is useful to be able to programmatically determine the coordinate ranges of any GeoMedia geometry object, e.g. polygon, point, line, etc. The example C# code snippet below is from part of a 'driving GeoMedia application' that illustrates how to get the geometry range coordinates.


// ...etc...
using GeoMedia = Intergraph.GeoMedia.GeoMedia;
using GeoMath = Intergraph.GeoMedia.GeoMathSvc;
using PBasic = Intergraph.GeoMedia.PBasic;
// ...etc...
 
// Create a new instance of the GeoMedia application framework
private GeoMedia.Application _application = (GeoMedia.Application)Activator.CreateInstance(GeoMediaType);
//...etc..
 
// pass in any geometry object as objGeom and read the min range from loRange and the max range from hiRange
public void GetAnyGeometryRange(object objGeom, out PBasic.point lowRange, out PBasic.point highRange)
{
GeoMath.GeoMathService geoMathSvc;    //the GeoMedia Math Service object
GeoMath.point lowerLeftPoint, upperRightPoint;    //the lower left and upper right GeoMedia point objects
 
//Use the GeoMedia application to create the GeoMedia point objects for storing the min and max range points
lowerLeftPoint = (GeoMath.point)_application.CreateService("GeoMedia.point");
upperRightPoint = (GeoMath.point)_application.CreateService("GeoMedia.point");
 
//Create the GeoMedia Math Service
geoMathSvc = (GeoMath.GeoMathService)_application.CreateService("GeoMedia.GeoMathService");

//Use the GeoMedia Math Service to calculate the geometry range
geoMathSvc.GetRange(objGeom, lowerLeftPoint, upperRightPoint);
 
//Store the range points for passing back the values to the calling function
lowRange = (PBasic.point) lowerLeftPoint;
highRange = (PBasic.point) upperRightPoint;
 
//finally free up the memory used by the GeoMedia Math Service COM object
if (geoMathSvc != null) 
Marshal.FinalReleaseComObject(geoMathSvc);
}

Monday, March 12, 2012

C# code to determine if the polygon vertices are in the clockwise direction

In some GIS polygon data formats such as the ESRI shape file format, the holes of a polygon are stored in the counter-clockwise direction while the outer polygon is stored in the clockwise direction. If you are writing a program to read a polygon geometry containing holes, it may be necessary to determine the holes by checking whether the vertices are in the counter-clockwise or clockwise direction.

The C# code snippet below is useful to determine whether the vertices of a polygon are in the clockwise direction or counter clockwise direction. Simply pass in the polygon vertices into the function as an array of PointF structures where the first and last member of the array are the same point. The function will return true if the vertices are in the clockwise direction and false if they are in the counter-clockwise direction.


private bool IsClockwisePolygon(PointF[] polygon)
{
bool isClockwise = false;
double sum = 0;
for ( int i = 0; i < polygon.Length-1; i++)
{
sum += (polygon[i + 1].X - polygon[i].X) * (polygon[i + 1].Y + polygon[i].Y);
}
isClockwise = (sum > 0) ? true : false;
return isClockwise;
}

Monday, March 5, 2012

Counting trees using segmentation and vectorization in SAGA Gis

Digital surface models (DSM) and digital terrain models (DTM) derived from LiDAR datasets can be used to count the number of trees in an area. There are many methods available, some more complex than others. Here is another example of doing a simple tree count using SAGA GIS' Watershed Segmentation algorithm followed by the Vectorization function. The general steps are:

  1. Load in the DSM and DTM grid datasets
  2. Calculate the canopy heights
  3. Smooth the canopy heights grid
  4. Segment the canopy heights
  5. Remove low canopy heights
  6. Convert the segments to vector polygons


Load the DSM and DTM grid datasets
  1. Start SAGA GIS. Load the DSM ArcGrid file e.g. C:\data\dsm.asc.
  2. Load the DTM ArcGrid file e.g. C:\data\dtm.asc.
Calculate the canopy heights
  1. Select Modules | Grid | Calculus | Grid Difference.

    The Grid Difference dialog box appears.
  2. In the Grid system field, choose the system of the source datasets, e.g. 683x 683y; 312480x 51952717y.
  3. In the A field, choose the digital surface model grid, e.g. dsm.
  4. In the B field, choose the digital terrain model grid, e.g. dtm.
  5. Click Okay.

    The canopy height grid is created.


Smooth the canopy heights
  1. Select Modules | Grid | Filter | Gaussian Filter.

    The Gaussian Filter dialog box appears.
  2. In the Grid system field, choose the system of the source grid e.g. 683x 683y; 312480x 51952717y.
  3. In the Grid field, choose the canopy height grid, e.g. Difference (A-B).
  4. In the output Filtered Grid field, choose Create.
  5. In the Search Radius field, choose a value to approximate the tree radius e .g. 5.
  6. Click Okay.

    The smoothed canopy height grid is created.
Segment the smoothed canopy heights

  1. Select Modules | Imagery | Segmentation | Watershed Segmentation.

    The Watershed Segmentation dialog box appears.
  2. In the Grid system field, choose the grid system of the smoothed grid layer.
  3. In the source Grid field, choose the smoothed grid layer e.g. Difference (A-B) [Gaussian Filter].
  4. In the Output field, choose Seed.
  5. Make sure the Method is set to Maxima.
  6. Click Okay.

    The canopy heights grid layer is segmented according to maximum heights.

Apply a height break limit (removing segments below a certain height)

  1. Select Modules | Grid | Calculus | Grid Calculator.

    The Grid Calculator dialog box appears.
  2. In the Grid system field, choose the system of the segmented layer.
  3. In the Grids field, click the browse button. In the Grids dialog box that pops up, double click on the segmented  grid layer e.g. "Difference (A-B) [Gaussian Filter][Segments]". Click Okay.
  4. In the Formula field, type in the following: ifelse(lt(a,5),-99999,a).

    Note: if the grid value is less than 5, then change the grid value to voids (-99999).
  5. Click Okay.

    The grid layer with no values below the height break limit is created.
Convert the segments into vectors
  1. Select Modules | Shapes | Grid | Vectorization | Vectorising Grid Classes.

    The Vectorising Grid Classed dialog box appears.
  2. In the Grid system field, choose the system of the previously created grid layer.
  3. In the Grid field, choose the grid layer created in the previous step e.g. "Calculation [ifelse(lt(a,5),-99999,a)]".


  4. Click Okay.

    The vector polygon layer is created.
  5. Select the shape polygon layer in the Data tab. Then click the Description tab.

    The number of shapes shows the approximate count of the number of trees above a height break limit.


    The polygons can be displayed as table attribute records as shown below.