- Run QGIS. Display some layers, e.g. stations.

- In the Layer Panel, mouse right click on the layer to be labelled, e.g. stations.
A pop up menu appears.
- Choose Properties.
The Layer Properties dialog box appears.
- Choose Labels. In the combo box, select Show labels for this layer.

- In the Label with field, click the Expression icon.
The Expression dialog box appears.
- In the Expression tab, type in the syntax to form the multi-column label e.g.
name || ' ' || code.
Note: name and code are two columns from the layer database table, and || is the string concatenation operator and ' ' is a space character. - Click OK. And Click OK to apply the changes.
The labels appear.
- If multi-line labels are desired, then the newline character '\n' needs to be concatenated with the database fields in the Expression dialog box, as shown below.
name || '\n' || code
And the resultant map look like this.

About Geospatial Applications, FME, Visual Studio, gvSIG, Global Mapper, Programming, LiDAR, GIS, Google Maps, SAGA GIS, Android, QGIS
Showing posts with label Cartography. Show all posts
Showing posts with label Cartography. Show all posts
Monday, May 1, 2017
Create labels from multi-columns in QGIS
It is quite simple to create labels from one or more database columns in QGIS; just that you have to type in the correct syntax as shown below.


Monday, May 26, 2014
QGIS Export layers to SVG for cartographic editing in desktop publishing software
If there is a need to manipulate QGIS map layers for cartographic publishing purposes in vector editing software like Adobe Illustrator or the free and open source software Inkscape, there is a plugin - Simple SVG for that. The plugin is not perfect but it gives you probably enough to work on.
If the plugin is not installed in QGIS, simply run select Plugins | Manage and install Plugins... Then search for SimpleSvg, as shown below. Once located, just install it. There will be a Web pull down menu and an SVG icon in the tool bar.
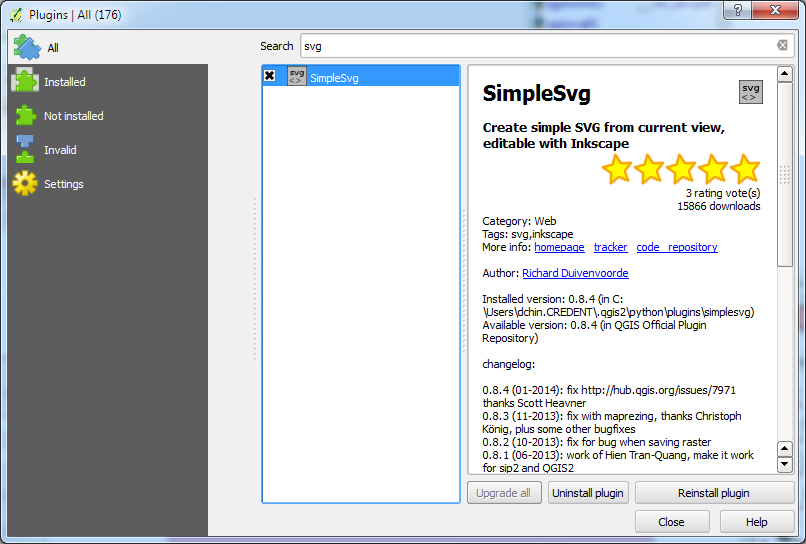
If the plugin is not installed in QGIS, simply run select Plugins | Manage and install Plugins... Then search for SimpleSvg, as shown below. Once located, just install it. There will be a Web pull down menu and an SVG icon in the tool bar.
- Using SimpleSvg is simple. Just display the layers you want to export to SVG. Resize the map view until you are happy with the extent.

- Then select Web | Save as SVG | Save as SVG.
The SimpleSvg dialog box appears.
- Type in the output SVG file path and name.
Note: On Windows, clicking the browse button will cause a Python error. So just key in the output file path and name.
- Click OK.
The SVG file is created.
- Open the resultant SVG file in a vector editing software such as Inkscape. Further cartographic editing can now be done on the resultant vector graphics.

Note: There is a bounding box feature in the resultant layer named qgisviewbox.
Each map feature is placed in its own layer, e.g. waterbody.
Each map feature is grouped together.
Monday, September 16, 2013
Trainsity Singapore Android app
 This is an Android app that simply displays the Singapore MRT and LRT train network maps. The maps are high resolution vector files instead of raster images; the file sizes are small and you can zoom closer without having the details becoming blurred or "pixelated", like bitmap images. The maps also have some interactivity coded in - when the train station labels are touched (or clicked), an option menu will pop up. Users can then choose to send the station location to the Google Maps or the Google Street View apps, where they can visualize the surroundings and/or perform directions routing.
The following screenshots show how the app behaves on a mobile handset.


On tablets, the app will automatically configure itself as a two pane display, as shown below. An ActionBar toggle button can be used to toggle the map display from two pane to full screen.


The app can be download from the Google Play Store.

Monday, July 29, 2013
Use Saga GIS to create Voronoi or Thiessen polygons
The new version of Saga GIS 2.1 has a functional Thiessen polygon command. Previously, a bug in the function creates erroneous polygons. Here is an example of using the command to create Voronoi or Thiessen polygons from discrete points with some polygon clipping thrown in for aesthetic effects. The example shows how to create polygons of cities in the great State of Texas.


- Start SAGA GIS. Load and display the cities and the state boundary polygon in a map view.
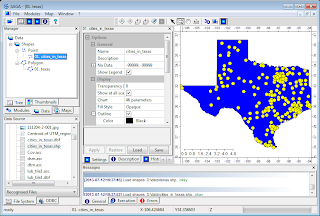
- Select Modules | Shapes | Points | Thiessen Polygons.
The Thiessen Polygons dialog box appears.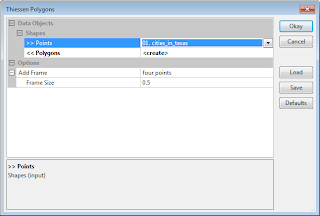
- In the input Points field, choose the point layer, e.g. 01. cities_in_texas.
- In the output Polygons field, select create. Click Okay.
The Thiessen polygons layer (02. cities_in_texas [Thiessen Polygons] is created. The polygons are spread out over some arbitrary four points.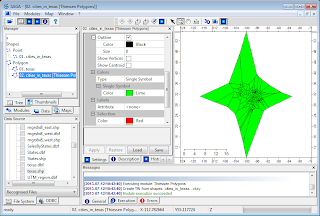
- Select Modules | Shapes | Polygons | Polygon Clipping.
The Polygon Clipping dialog box appears.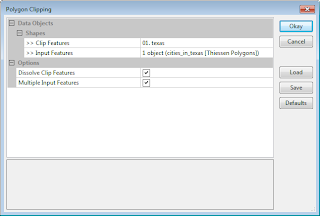
- In the Clip Features field, select the State boundary polygon layer, e.g. 01. texas.
- Select the Input Features field and click the [...] button.
The Input Features dialog box appears.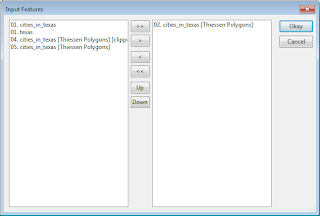
- In the left list, select the Thiessen Polygons layer, e.g. 02. cities_in_texas [Thiessen Polygons]. Click the > button. Click Okay.
The Input Features dialog box is closed. - Click the Okay button.
The Thiessen polygons are nicely clipped to the State polygon.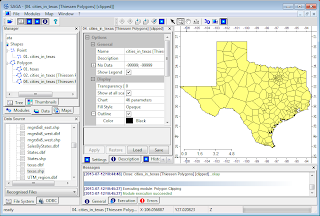


Monday, June 24, 2013
Create bar charts on Google Maps
This Mapplet was developed to create bar charts (vertical or horizontal) on Google Maps from text files formatted as comma separated values (CSV). An example screenshot of vertical bar charts is shown below.
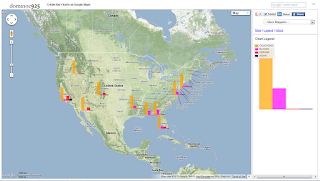
Creating the bar charts is simple as shown below:

Creating the bar charts is simple as shown below:
- Run the Mapplet by opening this link http://dominoc925-pages.appspot.com/mapplets/map_barcharts.html from any modern browser.
- Click Import CSV.
The Import Comma Separated Values (CSV) File dialog appears.
Note: The CSV data must have a header row, geographic latitude and longitude columns to point to the locations to place the charts on. - Click Choose File. Browse and select a CSV file. Alternatively, copy and paste the contents of a CSV file into the text box.
The CSV data is loaded into the text box. The color scheme combo boxes for each CSV data column appear.
- If necessary, choose the correct CSV Delimiter, Latitude Column, and Longitude Column from the combo boxes.
- From the Chart Orientation field, choose either Vertical or Horizontal.
- Optional. Choose the chart size in pixels.
- In the Color scheme combo boxes, choose the colors to represent the CSV data columns.
- Click Create Charts.
The horizontal bar charts are created.
- The charts created can be clicked on to show the values. The charts can also be dragged and moved to a different location on the map if necessary.


Monday, July 2, 2012
Use gvSIG to create Voronoi or Thiessen polygons
 A GIS software such as gvSIG can help marketers to create polygons representing regional areas of coverage for their companies' branch offices if none are available. All that is required are the points representing the offices and perhaps a polygon representing the overall area of coverage e.g. the State boundary.
The basic steps to create the regional areas are simply the following:
- Generate Voronoi or Thiessen polygons from the points
- Mask away the extra parts of the Voronoi polygons from the area of coverage polygon
For a detailed explanation of Voronoi or Thiessen polygons, visit the Wikipedia site http://en.wikipedia.org/wiki/Voronoi_diagram.
The example below illustrates how to generate the Voronoi polygons of cities in the state of Montana.
- Start gvSIG OADE. Load and display the cities and the state boundary polygon in a map view.

- Select View | Geoprocessing tools.
The Geoprocessing tools dialog box appears.
- Expand the Geoprocessing tools | Analysis | Computational geometry nodes. Double click Voronoi/Delaunay.
The Analysis tools dialog box appears.
- In the Input layer field, choose the points layer e.g. cities_in_montana.shp.
- Toggle on Voronoi(Thiessen) polygons.
- In the Output layer field, click Choose. In the Save dialog, type in the output layer name e.g. c:\temp\voronoi.shp. Click Save. Click OK.
The polygons are generated.
- If the Geoprocessing tools dialog box is closed, select View | Geoprocessing tools.

- Expand the Geoprocessing tools | Analysis | Overlay nodes. Double click on Intersection.
The Analysis tools dialog box appears.
- In the Input layer field, choose the newly created Voronoi polygons layer e.g. voronoi.shp.
- In the Overlay layer field, choose the overall area of coverage polygon layer e.g. montana.shp.
- In the Output layer field, click Choose. In the Save dialog box, type in the output layer name e.g. c:\temp\cities_coverage_pol.shp. Click Save.
- Click Ok.
The final regional area polygons are created and nicely masked.


Monday, April 16, 2012
Show Geographic Grid Google Mapplet
 I spent some time to put together this Google Mapplet that simply shows the latitude and longitude geographic grid lines and labels on Google Maps. The grid lines and labels will display and adjust themselves dynamically as you zoom in and out; from every few degrees until every second.
The screenshot below shows the grid lines and labels at the finest 1 second resolution.

To run this mapplet, just go to the site http://dominoc925-pages.appspot.com/mapplets/gridgeo.htm.
Monday, December 5, 2011
How to find out the digitized line directions in gvSIG
Sometimes it is useful to find out the direction the line work was digitized. It is possible to use the labeling function in gvSIG to display an indicator of the line direction as shown in the screenshot below.
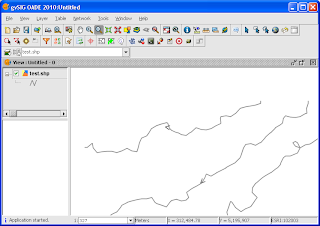
The steps to label the line work with "direction" indicators are outlined below.

The steps to label the line work with "direction" indicators are outlined below.
- Start gvSIG OADE 2010. Open a map view and load in a line geometry file e.g. test.shp.

- In the legend (TOC) pane, click the line layer. Right click the layer name with the mouse.
A popup menu appears. - Choose Properties.
The Layer properties dialog box appears.
- Click the Labeling tab.
- Toggle on Enable labeling. In the General field, choose Advanced settings.
- In the Method field, choose the Label all features in the same way.
- Click the Placement button.
The Placement properties dialog box appears.
- In the Orientation group, choose Follow line.
- In the Position group, choose On the line. In the Orientation drop down list, choose Line.
- In the Along lines field, choose In the middle.
- Choose to Place one label per feature part. Click OK.
- Click the Properties button.
The Label class properties dialog box appears.
- Click the first row in the Label no. grid. Then click the [...] button.
The Expression dialog box appears.
- In the Expression field, type in "<". Click OK.
- Toggle on Label features in this class and choose All features. Click OK.
- Click OK.
The digitized line directions are indicated with the "<" character.


Subscribe to:
Posts (Atom)
