Thursday, July 29, 2010

Visualize LiDAR LAS file in SAGA GIS

SAGA GIS is a free open source software package that I find useful for performing GIS grid analysis on raster data. The latest version 2.0.5 has some functions to read and write LiDAR LAS files including visualizing the LiDAR point clouds in 3D. Unlike other LAS file viewers where you simply choose the LAS file to display, there is a two step process involved when using SAGA to view LAS files. First, the LAS file has to be imported into SAGA's point cloud format. Once that is completed, you can then view the data either in 2D or 3D depending on the function you choose.

Import LAS file into SAGA GIS
  1. On the Windows desktop, choose Start | All Programs | SAGA GIS.

    The SAGA GIS application appears.

  2. Select Modules | File | Shapes | Import | Import LAS Files.

    The Import LAS Files dialog box appears.

  3. Click the Input File row. Then click the browse button on the right side. Browse and choose a LAS file. Click Open.

    The selected file name is displayed in the Input File row.
  4. Under the Attributes to import besides x,y,z list box, toggle on any attributes to be imported e.g. intensity. Click Okay.

    The LAS file is imported into SAGA GIS as a point cloud data set.
    Note: it may be necessary to click the Data tab on the Workspace pane
    .
Visualizing the LiDAR point cloud
  1. Select Modules | Shapes | Point Clouds | Visualization | Point Cloud Viewer.

    The Point Cloud Viewer dialog box appears.

  2. Click the drop down list on the right of the Points row. Choose the LiDAR point cloud data to visualize.

    The selected point cloud is displayed.

  3. Click Okay.

    The point cloud is displayed in the Point Cloud Viewer.
Using the Point Cloud Viewer
  1. To zoom in the main 3D view, roll the mouse wheel backwards.
  2. To zoom out in the main 3D view, roll the mouse wheel forward.
  3. To pan, press down the right mouse button and drag in the desired direction.
  4. To view a smaller subset of the point cloud, press down the left mouse button and drag out a subset box in the overview map on the bottom left. Then release the mouse button.

    Only the subset is displayed in the main 3D view.

  5. To freely rotate the 3D display in 3D, simply move the mouse over the 3D view and press down the left mouse button and drag in the direction you want to rotate.
  6. To change the display colors or other settings, click Advanced Settings.

    The Point Cloud Viewer Settings dialog box appears.

  7. To change the point colors, click the Colors row. Then click the [...] button on the right.

    The [CAP] Colors dialog box appears.

  8. Use the buttons to change the colors. Or click Presets to use preexisting schemes.

    The Preset Selection dialog box appears.

  9. Choose a scheme e.g. greyscale for coloring intensity points. Click Okay.

    The [CAP] Colors dialog box is updated.

  10. Click Okay. Then click Okay again to close the Point Cloud Viewer Settings dialog box.

    The 3D display is updated with the new settings.
  11. To color the points by another attribute other than the elevation e.g. intensity, click the Color Attribute drop down list and choose another attribute such as intensity.

    The 3D display is updated.

  12. To scale the points larger nearer to the viewing point, and smaller further away, toggle Scale Point Size on.


  13. To render for stereo red/blue glasses, toggle Anaglyph on.


Tuesday, July 27, 2010

Using Global Mapper to display non-elevation grid data

Global Mapper has nice rendering functions for displaying terrain elevation data; it is optimally designed for showing values in meters or feet. However, when you want to display other kinds of grid data e.g. in kilogram or degrees, you have to work a bit to get Global Mapper to display the data properly. It may be necessary to create your own color table file or custom shader in Global Mapper's terminology if you want to follow some specific color scheme. By default, the Elevation Legend shows values in meters or feet and it will be necessary to customize it to show the correct units. Here's how I did it to display an ESRI ArcGrid ASCII file containing slope values in degrees. .

Create a custom Surfer color table file
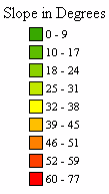
I have a specific slope color range from preexisting slope maps that I want to use to display the slope data, as shown below.

If I don't have the RGB values of the slope ranges above, then I can use an image editing program such as  Photoshop or GIMP to sample each color separately to get the RGB values. I prefer to create the custom color file outside of Global Mapper using a text editor. However, it is also possible to use the Global Mapper's Custom Shader graphical user interface to do the same thing.

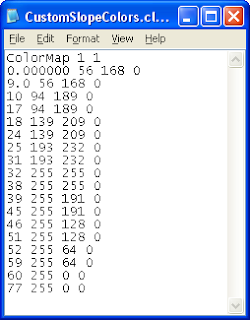
An example of how the color file looks like in Notepad is shown below.


The first line of "ColorMap 1 1" should not be changed. The data values and the corresponding RGB numbers follows.

For example, the line "0.000000 56 168 0" says the slope data value of 0.0 will have the darker green RGB color of 56, 168, 0. Then the next line "9.0 56 168 0" says the slope data value of 9.0 will have the same darker green RGB color of 56, 168, 0. These two lines define the color for the first slope range of 0 - 9 degrees. I repeat for the remaining slope ranges until I have completely defined the slope legend.

Display the slope grid data 
  1. Start up Global Mapper and load in the ESRI ArcGrid ASCII file containing slope data.

    The slope data is displayed in Global Mapper. Note the legend is showing the slope values as meters and hill shading is turned on.
  2. Click the shader drop down list. Choose Add Custom Shader as shown below.


    The Custom Shader dialog box appears.
  3. In the Name field, type in a meaningful name, e.g. My Slope Shader. Click Initialize From Surfer CLR File. Browse and choose the color file created in the previous section. Click Open.

    The color file is loaded and displayed in the Elevation Colors list box
    Note: the buttons here can be used to graphically define the color ranges also instead of using a text editor like I did
    .
  4. Click OK.
    The data is rendered with the new color scheme.
  5. It may be necessary to turn off the hill shading in the rendering. Press ALT+C.

    The Configuration dialog box appears.

  6. Click the Vertical Options tab. Toggle off Enable Hill Shading. Click OK.

    The slope data is displayed without hill shading. Note the Elevation Legend is labeling the slope values as meters instead of degrees.

Customize the Elevation Legend.
  1. Right click anywhere on the Elevation Legend.

    A popup menu appears.

  2. Choose Set Custom Elevation Units Display Text.

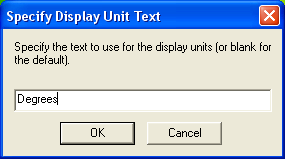
    The Specify Display Unit Text prompt appears.

  3. Type in Degrees. Click OK.

    The Elevation Legend correctly labels the slope values in degrees.

Thursday, July 22, 2010

Create Slope or Slope directions ESRI ArcGrid ASCII files with Global Mapper

Global Mapper can be used to generate terrain slope values or slope directions (aspect) grid files in ESRI ArcGrid ASCII formats from surface elevation data. This is a two part conversion process workflow instead of a straight export from surface elevation data. The conversion to slope values or directions involves: (1) conversion from elevation to slope values/directions in float/grid file format, and (2) conversion from float/grid format to ESRI ArcGrid ASCII format.

Conversion from elevation to slope values/directions in float/grid format
  1. Start up Global Mapper and load up a surface elevation dataset.
  2. Select File | Export Raster and Elevation Data | Export Float/Grid File.

    The Float/Grid Export Options dialog box appears.


  3. Optional: type in the desired sample spacing values and units.
  4. Toggle on Export Slope Values instead of Elevations to export slope values.
    Or toggle on Export Slope Direction Values Instead of Elevations to export slope directions.


  5. Click OK.

    The Save As dialog box appears.


  6. Type in the output file name e.g. slope.flt. Click Save.

    The elevation data is exported out as slope values or slope directions into the output file.
  7. Close Global Mapper.
Conversion from float/grid format to ESRI ASCII ArcGrid
  1. Start up a Global Mapper and load the slope values/directions float/grid file generated in the previous section.


  2.  Select File | Export Raster and Elevation Data | Export Arc ASCII Grid.

    The Arc ASCII Grid Export Options dialog box appears.


  3. Optional: type in the sample spacing values and choose a vertical unit.  Click OK.

    The Save As dialog box appears.
  4. Type in the output file name, e.g. slope.asc. Click Save.

    The slope values/directions ESRI ASCII ArcGrid file is created

Wednesday, July 14, 2010

Display slope or aspect maps with Global Mapper

Global Mapper can easily render a digital elevation model as a shaded relief display. The figure below shows a screenshot of a DEM rendered with Global Mapper's default Atlas Shader.

Sometimes, I may want to see the elevatiion model in terms of its slope values or its aspect (slope direction) values. In other grid analysis software, I would have to generate a separate grid file just to see the slope display or the aspect display. Using Global Mapper, I can simply choose the Slope Shader to render the DEM in terms of its slope values as shown below. Notice the legend on the left shows the slope values in degrees and the corresponding colors. The white values indicate flatter terrain while the darker values indicate steeper terrain.


Similarly, to render the DEM in terms of its aspect, I can simply choose the Slope Direction Shader as shown in the figure below. The legend on the left shows the terrain aspect in degrees and the corresponding colors. North facing terrain is shown in green while south facing terrain is in red; blue indicates east facing terrain and west facing terrain is white.

Monday, July 5, 2010

Bulk update Microsoft Access database with VBA

Sometimes I want to perform a simple bulk update of records in a Microsoft Access database using plain SQL text as shown below.

UPDATE STORES SET BUILDING='EMPIRE STATE BUILDING' WHERE ID=10001;
UPDATE STORES SET BUILDING='BIG BEN' WHERE ID=100560;
UPDATE STORES SET BUILDING='EIFFEL TOWER' WHERE ID=103891;
...etc..

Previously, I wrote a Perl script that uses ODBC to do the job as described in my previous post. However, , I found myself in a situation recently without Perl and the DBI-ODBC module on my working computer. So I decided to explore bulk updating using Microsoft Access's built-in VBA engine. The following describes my method.

Create a public function in a VBA Module
First, create a function that executes the SQL statements in a series or in a loop.
  1. Start up Microsoft Access and open up a database to be updated.
  2. Press ALT+F11.

    The Microsoft Visual Basic editor appears. By default, a new module - Module1 is created.
  3. In the editor, create a new public function e.g. BulkUpdate by typing in the following VBA code:

  4. Using any text editor e.g. Notepad, enclose the bulk update SQL statements with double quotes and prefix with the statements with db.Execute as shown below.


    db.Execute "UPDATE STORES SET BUILDING='EMPIRE STATE BUILDING' WHERE ID=10001;"
    db.Execute "UPDATE STORES SET BUILDING='BIG BEN' WHERE ID=100560;"
    db.Execute "UPDATE STORES SET BUILDING='EIFFEL TOWER' WHERE ID=103891;"
    ...etc..
  5. In the VBA Editor, copy and paste the bulk update sql text into the public BulkUpdate function.

  6. Select File | Save.

    The Save As dialog box appears.
  7. Optional. In the Module Name field, type in a name e.g. Module1. Click OK.

    The module is saved.
  8. Select File | Exit to close the VBA editor. 

Create a Macro

Next, create a Microsoft Access macro to call the previously created public function.
  1. Click New as shown in the figure below.


    The Macros dialog box appears.
  2. Click the Action drop down list. Choose RunCode.

    The Function Name field appears.
  3. In the Function Name field, click the Build button.

    The Expression Builder dialog box appears.
  4. Double click Functions.

    The available VBA module names appears.
  5. Choose the current database e.g. test. Choose the previously create module e.g. Module1. Double click the previously created public function e.g. BulkUpdate.

    The selected function appears in the expression field.
  6. Click OK.

  7. Close the Macro dialog box.

    The prompt appears.
  8. Click Yes.

    The Save As dialog box appears.
  9. Type in a macro name e.g. Macro1. Click OK.

    The macro is saved.
Run the bulk update
  1. In the Database dialog, choose Macros. Choose the previously created macro e.g. Macro1.

  2. Click Run.

    The selected macro executes the BulkUpdate function, which performs the bulk updating of records.
The example VBA code above is quite simple; there is no error handling. If you have the inclination, it can be made more sophisticated to handle errors in the bulk update statements. But for my needs, it was sufficient.