Monday, June 24, 2013

Create bar charts on Google Maps

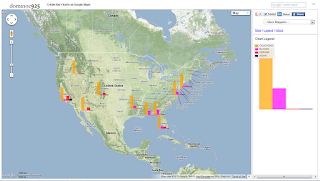
This Mapplet was developed to create bar charts (vertical or horizontal) on Google Maps from text files formatted as comma separated values (CSV). An example screenshot of vertical bar charts is shown below. 


Creating the bar charts is simple as shown below:

  1. Run the Mapplet by opening this link http://dominoc925-pages.appspot.com/mapplets/map_barcharts.html from any modern browser.
  2. Click Import CSV.

    The Import Comma Separated Values (CSV) File dialog appears.

    NoteThe CSV data must have a header row, geographic latitude and longitude columns to point to the locations to place the charts on.
  3. Click Choose File. Browse and select a CSV file. Alternatively, copy and paste the contents of a CSV file into the text box.

    The CSV data is loaded into the text box. The color scheme combo boxes for each CSV data column appear.

  4. If necessary, choose the correct CSV Delimiter, Latitude Column, and Longitude Column from the combo boxes.
  5. From the Chart Orientation field, choose either Vertical or Horizontal.
  6. Optional. Choose the chart size in pixels.
  7. In the Color scheme combo boxes, choose the colors to represent the CSV data columns.
  8. Click Create Charts.

    The horizontal bar charts are created.

  9.  The charts created can be clicked on to show the values. The charts can also be dragged and moved to a different location on the map if necessary.

Monday, June 17, 2013

Android App KoordKonverter for converting coordinates


KoordKonverter is a handy app for converting geo-coordinate points between various coordinate reference systems. The app currently supports Universal Transverse Mercator (UTM)Military Grid Reference System (MGRS), Singapore SVY21, and geographic latitude/longitude systems. It uses the global WGS 84 ellipsoid for the datum only.


  1. Simply choose the Input coordinate reference system from the Spinner widget, e.g. MGRS.


  2. Type in or choose the coordinate values to convert, e.g. 14QNL3066125500.

    Note: For some coordinate systems, a wheel picker may pop up for selecting coordinate values. Click Set.


  3. For information about the current coordinate reference system, touch the "i" button on the right.

    The projection, datum transformation parameters, and ellipsoid details appear.

  4. Select the Output Coordinate Reference System e.g. Geographic Lat/Lon.
  5. Click Convert.

    The converted result appears.
  6. Optional. Click Maps to pass the input coordinates to the default Maps App e.g. Google Maps.

    The point is plotted on the map.

  7. Touch the Menu button and choose Share result to pass the output to another Android app e.g. Clipboard, file, email, Dropbox, etc.
Get it on Google Play

Monday, June 10, 2013

Display LiDAR LAS file in Cloud Compare

Cloud Compare, a 3-D point cloud and mesh processing open source software can be used to display LiDAR LAS files. Being a generic point cloud processing software, it has the tools to manipulate the point clouds including filtering by point scalar values e.g. LAS classification, editing, mesh creation, among other functions. The following steps demonstrate displaying a LAS file's ground points as a point cloud as well as a 3-D surface mesh.

  1. Start Cloud Compare.

    The CloudCompare application window appears.

  2. Select File | Open.

    The Open file(s) dialog box appears.

  3. Browse and select a LAS lidar point cloud (*.las, *.laz) file e.g. lub_tile1.las. Click Open.

    The LAS file point cloud is displayed. In this example, the blue points are ground points while the red points are the vegetation points.

  4. With the mouse, click and drag anywhere within the graphic view. Roll the mouse wheel forward or backward to zoom in/put the graphic view.

    A RGB 3-D direction indicator sphere appears and the point cloud display is reoriented according to the direction of the mouse movement.

  5. In the DB Tree pane, select the point cloud e.g. lub_tile1 - Cloud.
  6. Select Edit | Scalar Fields | Filter by Value.

    The Filter by scalar value dialog box appears.

  7. Since we want to display only the ground points, change the Min and Max values to 2.0 (i.e. the LAS classification for ground). Click OK.

    A point cloud lub_tile1 - Cloud.extract is extracted from the selected point cloud.

  8. In the DB Tree, select the extracted point cloud. In the Properties pane, it may be necessary to change the display to LAS Classification instead of Return number.
  9. Select Edit | Mesh | Delaunay 2D (axis aligned plane).

    A mesh is created from the ground points. However, it is hard to distinguish features from the display because there is no shadow or texture.

  10. Select Display | Shaders & filters | E.D.L.

    The EDL (Eye Dome Lighting) shader is applied. Now the ground texture can be seen

Monday, June 3, 2013

Set the ImageButton background to transparent in Android

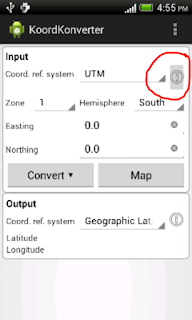
If a transparent icon source only is used in the ImageButton widget in Android, then the transparent portion of the icon is displayed on top of a default grey looking button as shown in the screen shot below.

It is possible to render the default grey button as transparent by changing the android:background property of the ImageButton to Android's selectableItemBackground drawable. An example of this is the following XML layout code below.


<ImageButton
android:id="@+id/inputInfoButton"
android:layout_width="0dp"
android:layout_weight="0.1"
android:layout_height="wrap_content"
android:contentDescription="Input coordinate reference system info"
android:background="@android/drawable/selectableItemBackground"
android:src="@android:drawable/ic_menu_info_details"
/>   

The resultant ImageButton should look like the screenshot below - no more default  grey button color for the ImageButton.

Note that this property will only work on Android versions 11 (Honeycomb) and above.