Monday, June 27, 2011

Create a grid tile layout using Global Mapper

A region of interest may cover a large area. The file sizes of Geospatial data such as LiDAR or aerial photographs acquired over the entire region of interest will obviously be too large to be stored as a single physical file. In order to work with the data, geographers will have to cut the data into manageable tiles. For this purpose, a grid tile layout with some sort of naming scheme and dimensions will have to be designed and created.

An example of a tile layout is shown below. In this example, the tiles are named according to the lower left coordinates i.e. X_Y, where X = x coordinate divided by 1000 and Y = y coordinate divided by 1000; and a tile has a width of 2000 meters and a height of 2000 meters.
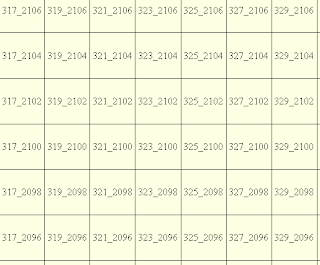
Global Mapper can be used to create the grid tile layout from a region of interest polygon.
  1. Start Global Mapper. Load and display the region of interest polygon.
  2. Press ALT+C to display the Overlay Control Center.

  3. In the Overlay Control Center, select the region of interest layer. Click Metadata.

    The Metadata dialog box appears.

  4. Take note of the UPPER LEFT X, UPPER LEFT Y, LOWER RIGHT X, and LOWER RIGHT Y attributes.
  5. Since the UPPER LEFT X value is 305458, an appropriate grid origin x value would be 305000, i.e. a round down.
  6. Since the UPPER LEFT Y value is 2119255, an appropriate grid origin y value would be 2120000, i.e. a round up.
  7. Since the difference between the LOWER RIGHT X and UPPER LEFT X is 55326 (360784 - 305458), then an appropriate number of grid columns would be 28, i.e. 55326/2000 where 2000 is the grid width.
  8. Since the difference between the UPPER LEFT Y and LOWER RIGHT Y is 41187 (2119255 - 2078068), then an appropriate number of grid rows would be 21, i.e. 41187/2000 where 2000 is the grid height.
  9. Close the Metadata dialog box.
  10. Select ALT+D. Click the Create Regular Grid of Features  icon.

    The status bar shows the message "Left Click to Select Grid Anchor Point, ...".
  11. Click a point anywhere inside the map window.

    The Grid Setup dialog box appears.

  12. In the Number of Grid Rows field, type in 21.
  13. In the Number of Grid Columns field, type in 28.
  14. In the Grid Cell Width field, type in 2000 meters.
  15. In the Grid Cell Height field, type in 2000 meters.
  16. Click Anchor Point.

    The Select Location dialog box appears.

  17. In the X Coordinate field, type in 305000.
  18. In the Y Coordinate field, type in 2120000.
  19. Click OK.
  20. Toggle on Separate Row/Column Letters or Numbers. Toggle on Numbers.
  21. In the Rows Start field, type in 2120. In the Rows Step field, type in -2.
  22. In the Columns Start field, type in 305. In the Columns Step field, type in 2.
  23. Toggle on Reverse Naming, Prepend 0, and Separate Rows and Columns with Underscore.

  24. Click OK.

    The grid tile layout is created.

Monday, June 20, 2011

Graphically locate the lowest and highest DEM points in Global Mapper

Global Mapper 12 has a function to find the extreme elevation values in a digital elevation model (DEM) layer. It can only create a text file reporting on the lowest and highest elevations in a layer including the coordinates. If I want to locate the points on the map, then I will have to open up the text file and try to locate the points manually on the map. I found an alternative way to find the highest and lowest elevation points within a polygon graphically. It involves a bit of work as described below.
  1. Run Global Mapper. Load in a DEM file e.g. ground.asc.

  2. Press ALT+C to display the Control Center.
  3. In the Overlay Control Center, mouse right click on the DEM layer.

    A pop up menu appears.
  4. Choose Create Point Features at Elevation Grid Cell Centers.

    A new point layer "ground.asc Points" is created.

  5. Load in or create a polygon to define the area of interest for analysis.

  6. In the Overlay Control Center, toggle off the DEM e.g. ground.asc and the derivate point layer e.g ground.asc Points.
  7. Press ALT+D. Mouse left click on the polygon.

    The polygon is selected.
  8. Mouse right click anywhere on a blank space on the map window.

    A pop up menu appears.
  9. Choose Advanced Selection Options | Select All Point Features   within the Selected Area(s).

    The points inside the polygon are selected.
  10. Mouse right click on a blank space in the map window.

    A pop up menu appears.
  11. Choose Edit Selected Features.

    The Modify Selected Point Features dialog box appears.
  12. In the Feature Layer combo box, choose Create New Layer for Feature. Click OK.

    The Enter Layer Name dialog box appears.
  13. Type in a new layer name e.g. aoi. Click OK.

    The selected points are moved to their own layer.
  14. In the Overlay Control Center dialog box ,toggle off all the layers except the newly create layer aoi.

  15. Select Search | Search by Attributes, Names and Description.

    The Search Vector Data dialog box appears.
  16. Click the ELEVATION column header.

    The ELEVATION column is sorted in ascending order or descending order.
  17. Click on the lowest elevation record in the list to highlight the corresponding lowest elevation in the polygon on the terrain, and vice verse for the highest elevation.

    The location on the map is highlighted.

Monday, June 13, 2011

GeoMedia C# code snippet to connect to a WMS server

Recently I was asked to look at some C# code to connect and display a feature from a Web Mapping Service (WMS) server. I wrote some driving GeoMedia code to test out the connection.


//...cut...

//Create the connection to the WMS server
PClient.Connection conn = null;    //connection to the WMS server
MapviewLib.GMMapView map = (MapviewLib.GMMapView) mapWindow.MapView;
conn = (PClient.Connection) this.Application.CreateService("GeoMedia.Connection");
conn.Name = "WMS";
conn.Type = "WMS.GDatabase";
conn.Mode = 0;
conn.Description = "WMS";
conn.Location = "Not used";
conn.ConnectInfo = @"NOCSFFOUND=FAIL;URI=http://some.wms.com/wms.aspx";
conn.Connect();

//Now create a recordset to a WMS feature
PClient.OriginatingPipe OP;
conn.CreateOriginatingPipe(out OP);
OP.Table = "Feature1";

//Build a transformation path to/fro the map view coordinate system and the WMS and store the paths in the map view's CoordSystemsMgr object
PCSS.CoordSystem objCS = null;
PClient.ServerTransService objSTS = (PClient.ServerTransService)this.Application.CreateService("GeoMedia.ServerTransService");
PCSS.AltCoordSystemPath objAltCoordSystemPath = null;
PClient.GField objGeomFld = OP.OutputRecordset.GFields["Geometry"];
objSTS.CreateCSFromGeometryField( objGeomFld, out objCS);
objSTS.CreateSimpleTransFromCSMtoCS(map.CoordSystemsMgr, objCS, out objAltCoordSystemPath);

//Transform the WMS recordset to the map view's coordinate system
PDBPipe.CSSTransformPipe objXPipe = (PDBPipe.CSSTransformPipe)this.Application.CreateService("GeoMedia.CSSTransformPipe");
objXPipe.InputRecordset = (PDBPipe.GRecordset) OP.OutputRecordset;
objXPipe.InputGeometryFieldName = "Geometry";
objXPipe.CoordSystemsMgr = map.CoordSystemsMgr;
objXPipe.OutputCSGUID = map.CoordSystemsMgr.CoordSystem.GUID;

//Now we can use the transformed WMS recordset
PDBPipe.GRecordset wmsRS = objXPipe.OutputRecordset

//...etc...

Monday, June 6, 2011

Flagging dangles (free end points) with gvSIG

It is quite straightforward to flag dangles (or free end points) using the topology tools in gvSIG. Simply create a new topology rule to check for dangles on a linear layer(s), then run the validation. All the dangles would be flagged out as error points on the map.

To illustrate:

  1. Run gvSIG OADE 2010. Load and display a line layer e.g. lines.shp in the Map View.


    Note: the blue rectangles indicate the end points of the line segments for illustration purposes only.
  2. Select Tools | Topology | Create Topology.

    The Create topology wizard appears.

  3. Click Next.


  4. In the Topology name field, type in a string e.g. dangles.
  5. In the Cluster tolerance field, key in a value e.g. 1.
  6. In the Maximum number of errors, key in a value e.g. 20.
  7. Under the Layers to include in topology list, toggle on a layer e.g. line.shp. Click Next.


  8. Click Add.

    The Topology rules dialog box appears.

  9. In the Topology rule drop down list, choose All line geometries of A must be free of dangling nodes. Click OK.

    The rule is added to the list.

  10. Click Finish.

    A new group named dangles is added to the TOC (legend).

  11. In the legend, click the group dangles.
  12.  Select Tools | Topology | Validate Topology.

    A new layer dangles_error is created under the dangles group. The dangles are flagged in the Map View.

  13. Optional. Click on the dangles_error layer in the legend. Select Layer | Show Attribute Table.

    The Table: Attribute table:dangles_error dialog box appears.