Monday, January 27, 2014

Free 30 day trial LiDAR LAS Viewer from GeoKno

I tried out a free 30 day trial software LASViewer from GeoKno on some of my LiDAR LAS files. I found the software to have good display point cloud rendering functions, and decent windowing and navigation functions. The point cloud analysis and measurement functions are okay except for the lack in cross section profiling functions. However, I found the software to perform poorly in terms of speed and stability on mid size and larger LAS files.


Displaying a LAS file
  1. To open and display a LAS file, just drag and drop the file onto the LASViewer application.

    The Open Dialog pops up.
  2. Optional. In the Point skip option field, type in the number of points to decimate e.g. 10, if you want to reduce the number of points to display.
  3. Click OK.

    The point cloud is displayed.


    Note: LASViewer does not seem to be able to display more than one LAS file in the same view
Point cloud rendering
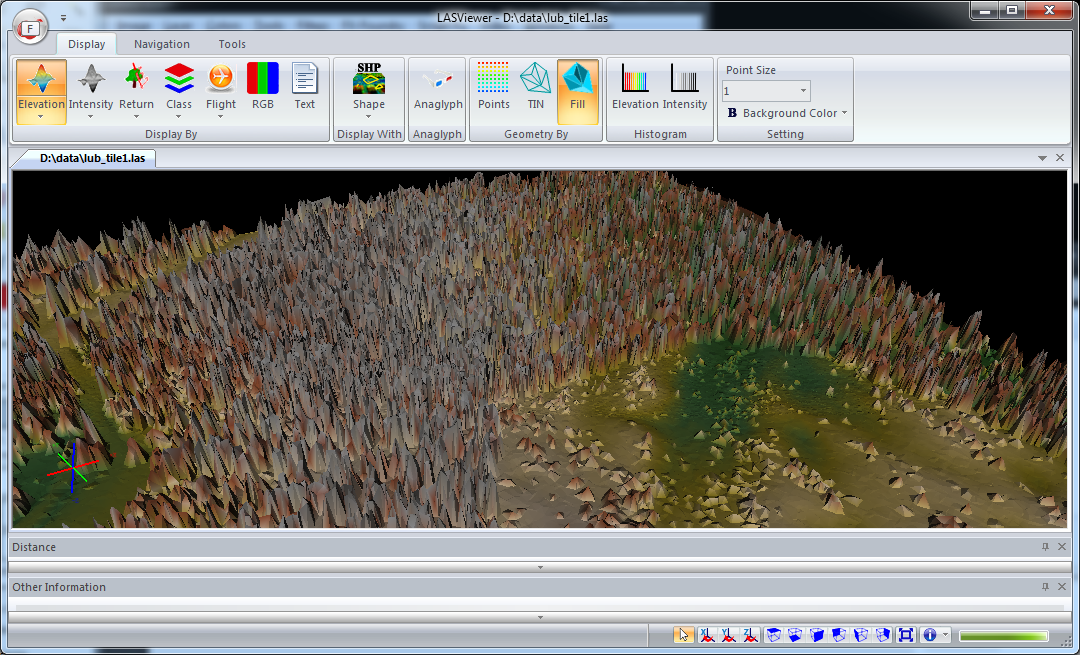
The point cloud can be displayed in a variety of ways including by color ranges (earth tones or blue to red), intensity gray scale, flight source id, classification, RGB. The software has the capability to render the cloud as discrete points, or as a surface wire frame or shaded triangles, as shown in the screenshot below.
 
Overlaying with vector Shapefiles
I found it quite useful to be able to overlay a vector ESRI Shapefile with the LiDAR point cloud. A common task is to examine the point cloud with the area of interest (AOI) vector polygon. To reference a Shapefile, simply do the following:

  1. Click Display | Display with SHP.

    The Open Dialog appears.
  2. Browse and select a Shapefile, e.g. contour.shp. Click Open.

    The Shapefile is overlaid over the point cloud.

Examine point information
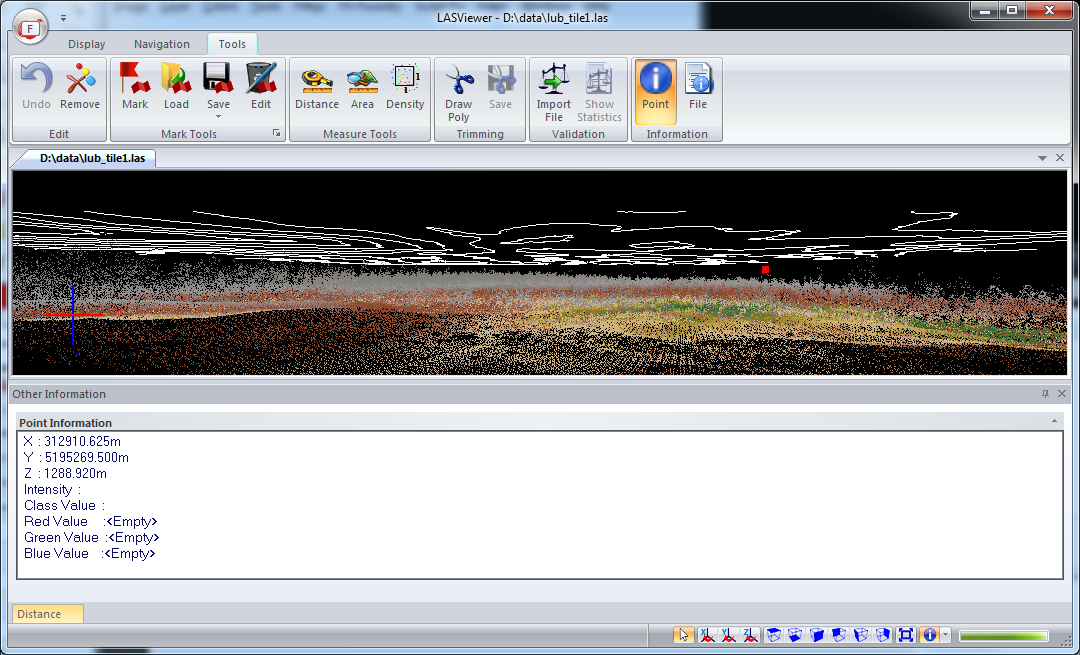
Another typical task is to examine information about a LiDAR point to review the return value or classification value or to determine the elevation. LASViewer has the Point Information Tool that can be used to display the LiDAR point values in a separate window, as shown below.

  1. Click Tools | Point.
  2. Click on a LiDAR point.

    The Point Information is displayed

Monday, January 20, 2014

Measure geodesic area on Google Maps

This Google Mapplet can be used to measure polygonal area and perimeter on a sphere in Google Maps using an open source library GeographicLib. Using the mapplet is easy - simply place click three or more points on the Google Maps backdrop to define a polygon; the area and perimeter values will be displayed in the centroid of the polygon.


The default units of measurement for area and perimeter, as well as the polygon boundary color can be changed by selecting the desired values in the right pane.

Once the measurement polygon has been placed on the map backdrop, the vertices can be adjusted either by manually dragging a vertex marker with the mouse or by clicking the vertex marker and entering refined latitude and longitude values.

A vertex marker can be deleted by clicking on the vertex marker and selecting the Delete option.

The mapplet can be found at this link http://dominoc925-pages.appspot.com/mapplets/geoarea.html.


Monday, January 13, 2014

Offline method to check a Javascript file for coding errors

There a a few web sites that can perform Javascript code checking for errors, but I wanted an offline method for those times when I am not on the net. I found a JSLint plug-in for my favorite text editor Notepad++ that can do the job.

A Javascript file in Notepad++

To install the JSLint plug-in, just run the Plugin Manager in Notepad++ and install the plug-in.


 Once the JSLint plugin is installed, the commands are accessible from the Plugins pulldown menu as shown below.

To use JSLint to validate a Javascript file, simply have the file opened in Notepad++, then select Plugins | JSLint | JSLint Current File.

The JSLint pane appears at the bottom with a list of code problems.

 You can use the JSLint Previous or Next commands (arrow icons highlighted in red above) to navigate from error to error, or double clicking an item in the list. The line with the selected error will be shown in the code above.

To validate the Javascript code again, just click the JSLint Current File command (single green tick icon highlighted in red above) to run the code checking again.

Monday, January 6, 2014

SpatiaLite query to join point features by distance

Sometimes I have two related point features in a SpatiaLite database, one feature layer (nodes) contains the identifier I need, and the other feature layer (stations) contains the attributes I want. The only relationship I can make use of is the spatial proximity between the two feature layers. The following screenshots illustrate the problem.
nodes and stations feature layers are within a certain distance from each other


The nodes table contain the required id and geometry. 

The stations table contains the desired attributes
The problem can be solved by formulating a simple spatial join query in SpatiaLite. The following shows how to do the job (using QGIS to submit the query to the SpatiaLite database).

  1. In QGIS, select Database | DB Manager | DB Manager.

    The DB Manager appears.
  2. In the tree view, select the SpatiaLite database containing the two feature layers, e.g. vancity.sqlite.
  3. Click SQL Window.

    The SQL  Window appears.
  4. Type in the following SQL query.

    select b.id as id,
    a.code,
    a.name,
    y(transform(a.geometry, 4326)) as lat,
    x(transform(a.geometry,4326)) as lng
    from stations as a
    join nodes as b
    on (ST_DISTANCE(a.Geometry,b.Geometry) < 10)


    Note: it may be necessary to adjust the ST_DISTANCE function's maximum distance between both features so that it doesn't leave out or include features.
  5. Click Execute.

    The join results appear.
  6. Optional. If you want to display the results on the map, then the query should include the desired geometry field as shown below.

    select b.id as id, 
    a.code, 
    a.name, 
    y(transform(a.geometry, 4326)) as lat,
    x(transform(a.geometry,4326)) as lng,b.geometry
    from stations as 
    join nodes as 
    on (ST_DISTANCE(a.Geometry,b.Geometry) < 10)


    Toggle on Load as new layer. Choose the primary key e.g. id in the Column with unique integer values field. Choose the geometry field in the Geometry column field. Type in a Layer name (prefix) e.g. tmp. Click Load now!.

    The results layer is loaded in the map.

Monday, December 30, 2013

Measure geodesic distances on Google Maps

As the name suggests, this Measure Geodesic Distance mapplet allows users to measure the geodesic distance between two or more points on the earth's surface using the Haversine formula. The mapplet uses the formulas from this site http://www.movable-type.co.uk/scripts/latlong.html. The measurement points and lines are displayed on a Google Maps backdrop. Users have the option to choose the measurement units of meters, kilometers or miles: the line color can also be set by the user.

Run the mapplet from this site http://dominoc925-pages.appspot.com/mapplets/geodistance.html

Using the mapplet is easy, just do the following:

  1. Click two or more points on the map.

    Vertex markers are displayed, and geodetic lines are displayed between the vertex markers.
    Note I : the segment distance value is displayed at the mid point of the line(s).
    Note II: the total distance value is displayed at the last vertex marker. 

  2. Drag a vertex marker to another location on the map.

    The geodetic lines and vertex markers are updated to show the new distances.

  3. Click on a vertex marker.

    The latitude and longitude values are displayed in an Info Window.
  4. In the Info Window, click Delete to delete the vertex marker.

    The vertex marker is removed and the lines and markers are updated to show the new distances.
  5. To adjust a vertex marker by precision key-in, click on a vertex marker.

    The latitude and longitude values are displayed in an Info Window.
  6. In the Info Window, type in the new latitude and/or longitude values. Click Save.

    The vertex marker is moved to the new location and the lines and markers are updated to show the new distances.
  7. To clear all the markers and lines from the map, click the Clear button in the right pane


Monday, December 23, 2013

Seattle 911 incidents monitoring WebApp

This WebApp allows users to monitor the City of Seattle's Fire Department's real time 911 dispatches (updated every five minutes) and the Seattle Police Department's 911 dispatch incident responses that are non-confidential (updated every 4 hours) on a Google Maps backdrop. Simply choose the appropriate feed on the 911 feed drop down menu on the right pane.


The 911 incidents are shown as clickable icons with tool tips on Google Maps. Clicking on an icon will bring up more details about the incident. Users can utilize additional built-in Google Maps features such as Street View, or 3-D oblique 45 degrees views to immerse themselves into the incident environment.


The 911 incidents are also shown as a list on the right pane. The list can be sorted by incident category, date-time and address - either in ascending or descending order. Clicking the Maps hyperlink will automatically locate, zoom, and center the incident in the Map view.

The WebApp can be launched from this link http://dominoc925-pages.appspot.com/webapp/seattle911mon/default.html

Monday, December 16, 2013

How to obfuscate an Android APK file using ProGuard in the Eclipse ADT

The classes in the Android APK can be obfuscated using the ProGuard tool in the Android Development Toolkit (ADT) in Eclipse. The following shows how to enable to source code obfuscation.
  1. In Eclipse, open up an Android project e.g. androidgames.
  2. Open up the file project.properties in the Eclipse text editor.


  3. Uncomment the following line by removing the # symbol in the first column.

    #proguard.config=${sdk.dir}/tools/proguard/proguard-android.txt:proguard-project.txt
  4. Optional. If there are any classes that you do not want to obfuscate, then the class must be added to the proguard-project.txt file, e.g. com.dom925.trains.manila.SvgInterface, as shown below.
# If your project uses WebView with JS, uncomment the following
# and specify the fully qualified class name to the JavaScript interface
# class:
#-keepclassmembers class fqcn.of.javascript.interface.for.webview {
#   public *;
#}
-keepclassmembers class com.dom925.trains.manila.SvgInterface {
public *;
}

An example of a decompiled obfuscated Android APK is shown below.