Monday, December 29, 2014

Trainsity Osaka Android App

Find your way around Osaka city's subway using the high resolution vector maps of the train network. The following metro rail lines are available:

  • Midosuji, 
  • Tanimachi, 
  • Yotsubashi, 
  • Chuo, 
  • Sennichimae, 
  • Sakaisuji, 
  • Nagahori-Tsurumi-ryokuchi, 
  • Imazatosuji, 
  • Newtram Nanko Port Town, 
  • Kita Osaka Kyuko, 
  • Kintetsu Keihanna, 
  • Hankyu Kyoto, 
  • Hankyu Senri, 
  • Osaka Monorail, and 
  • Kitakyu Namboku lines. 
The maps have small file size footprints but with many levels of zoom and can work offline without connecting to the Internet. Users can click the train station box labels to open Google Maps or Google StreetView, where they can use all the functions of the Google apps to visualize the surrounding area and/or perform routing for directions. There is also an offline function to calculate the best way to travel from a station to another station with a direction breakdown and timings (which may vary from the actual travelling time).

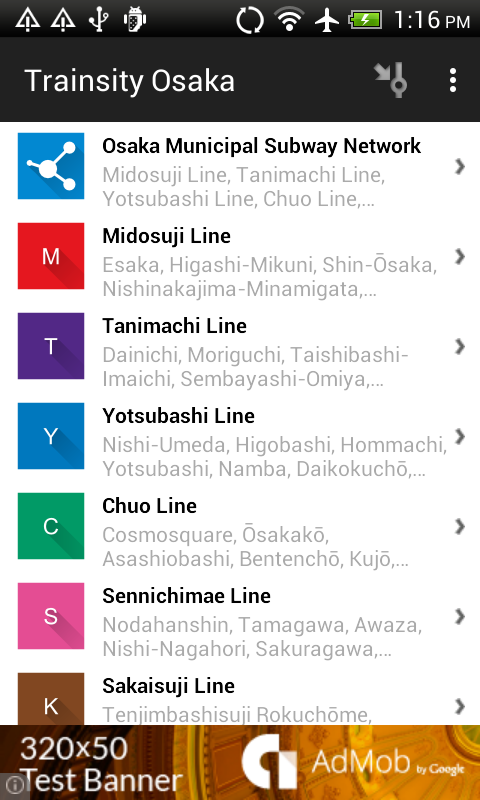
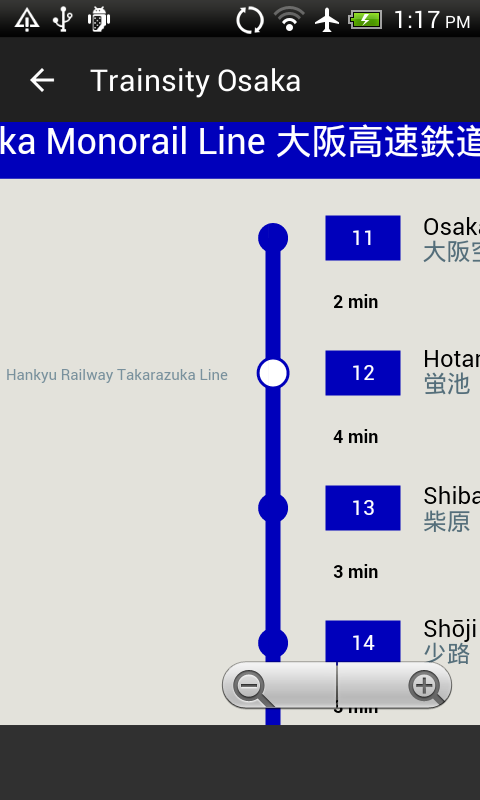
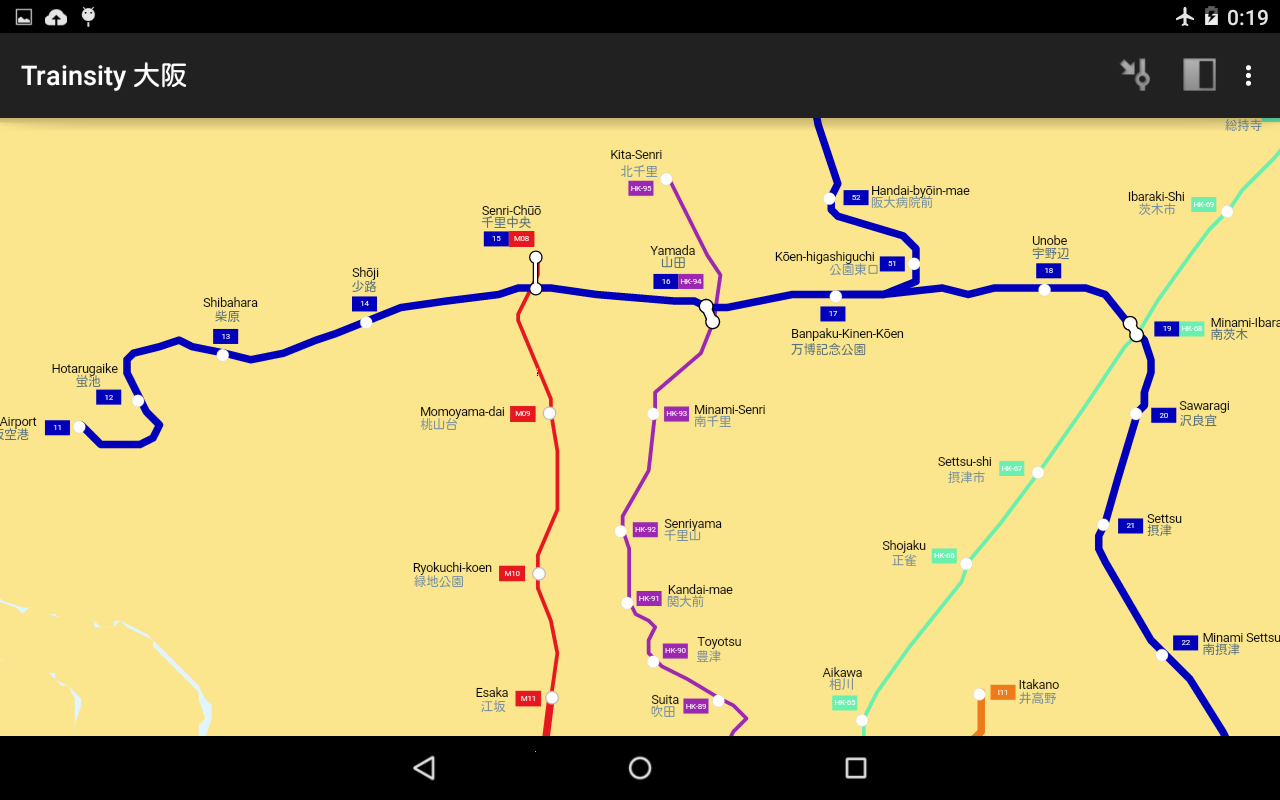
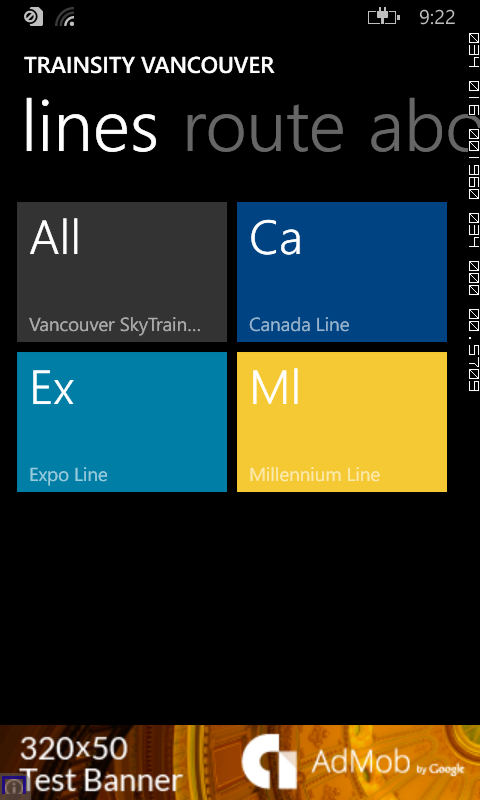
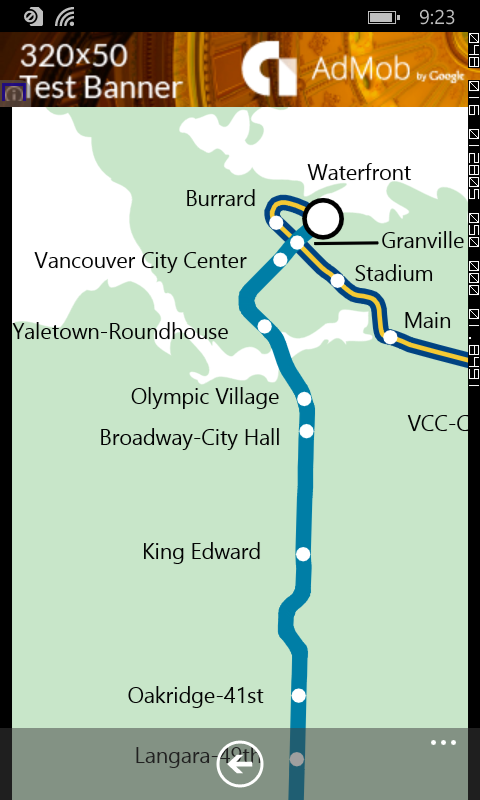
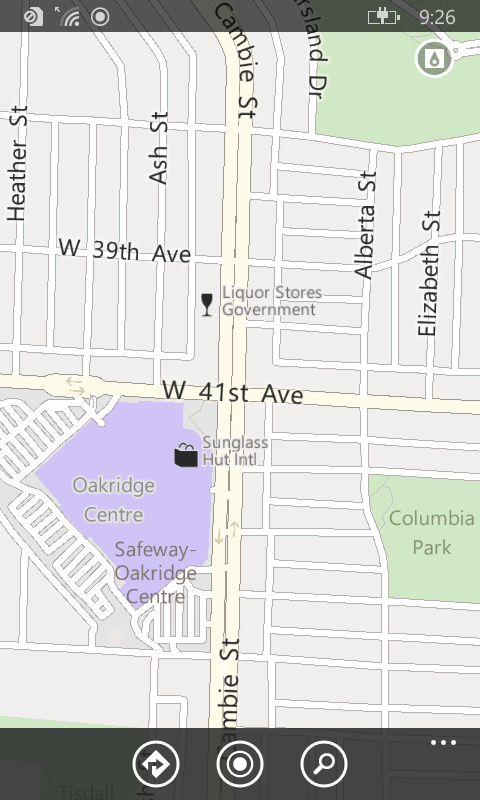
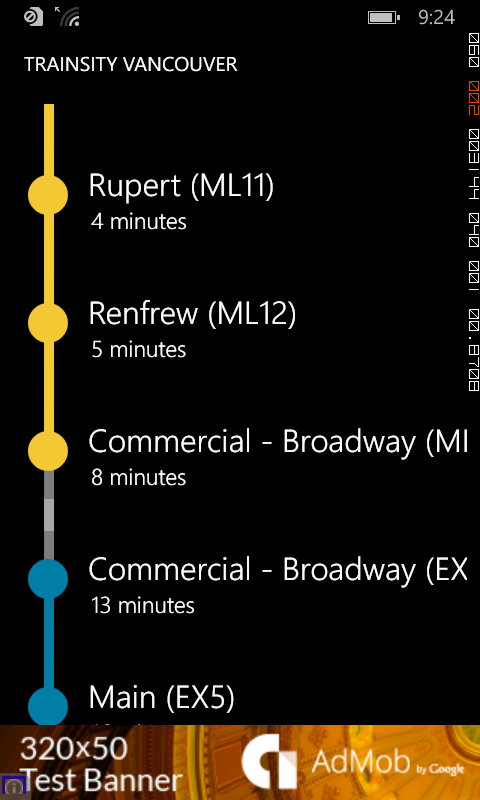
On a mobile handset, the app will display a list of train maps, which when tapped will open up a detail view of the subway transit map, as shown below.

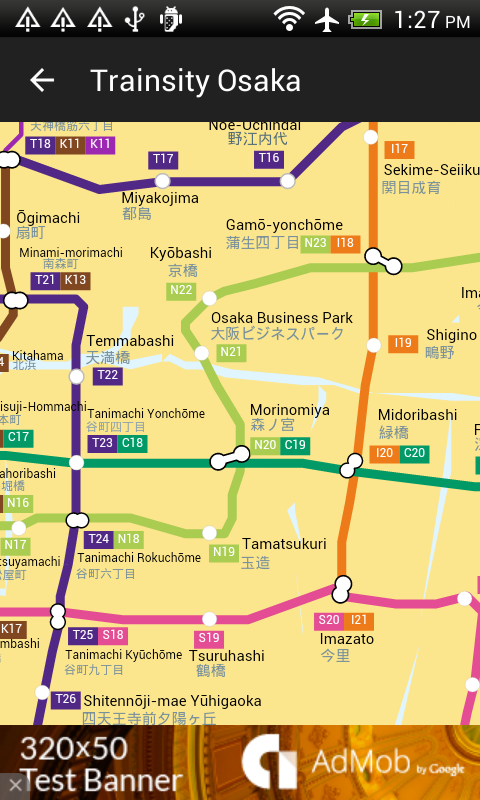
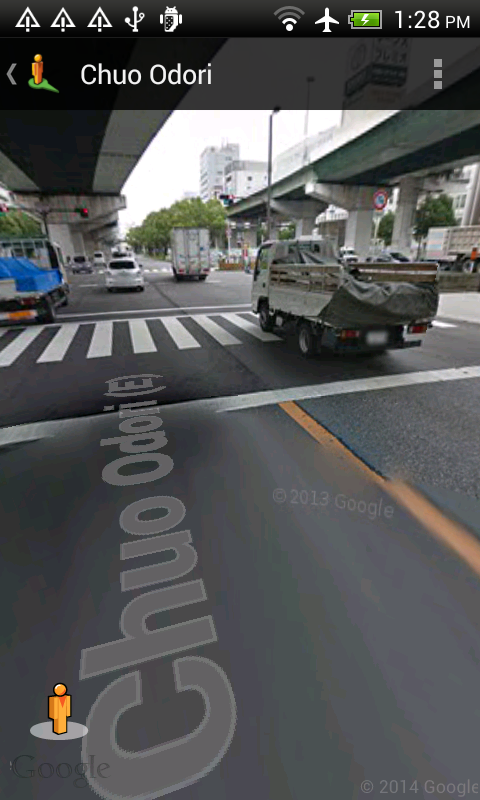
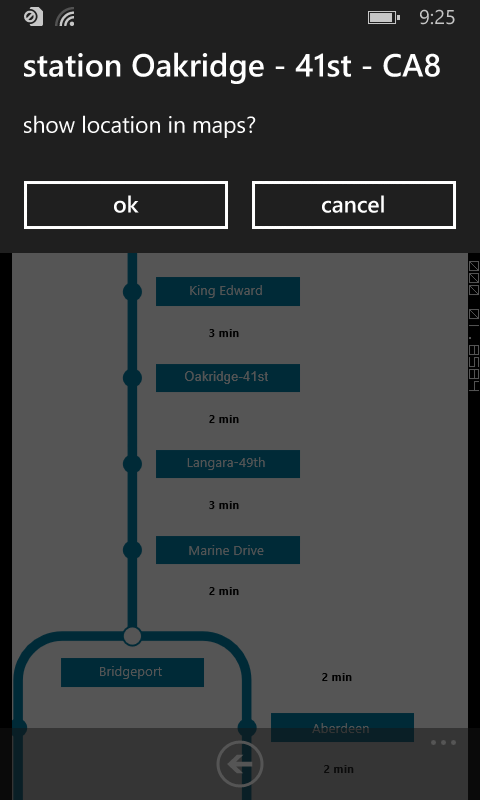
Tapping the station boxes will bring up an option menu where users can choose to display the station in Google Maps or Street View.

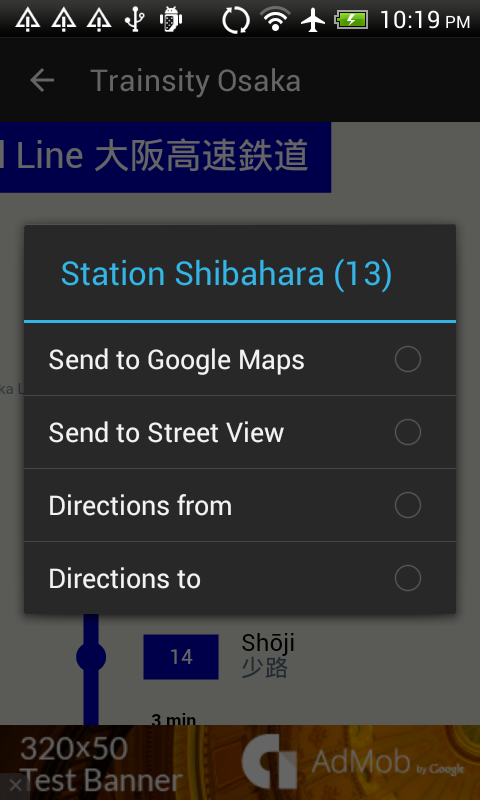
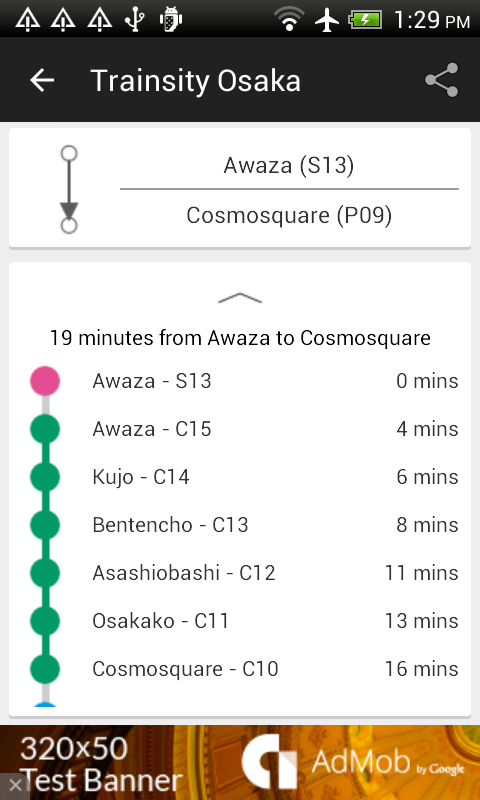
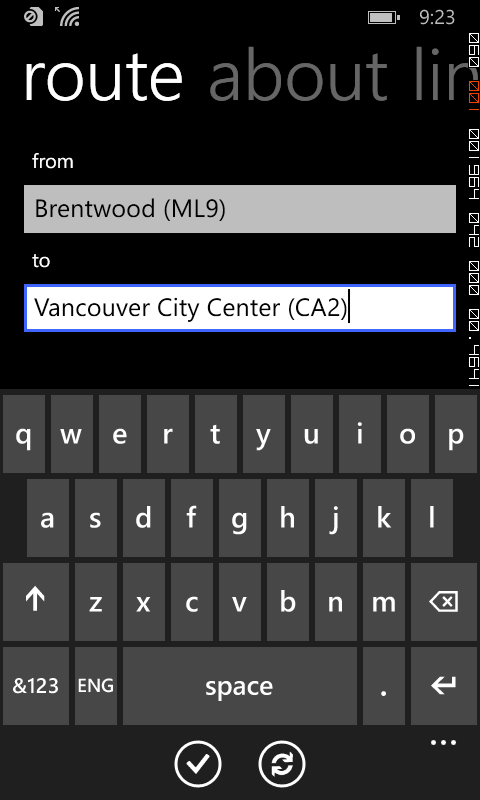
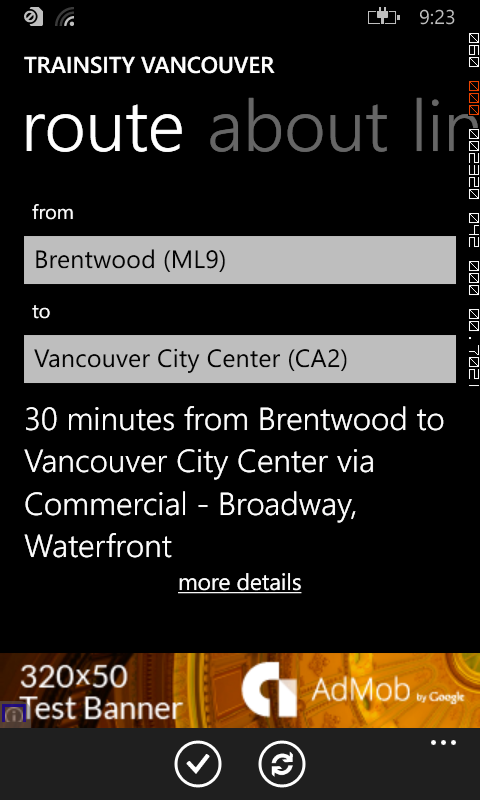
There is also an option to find the best direction to or from the tapped stations.

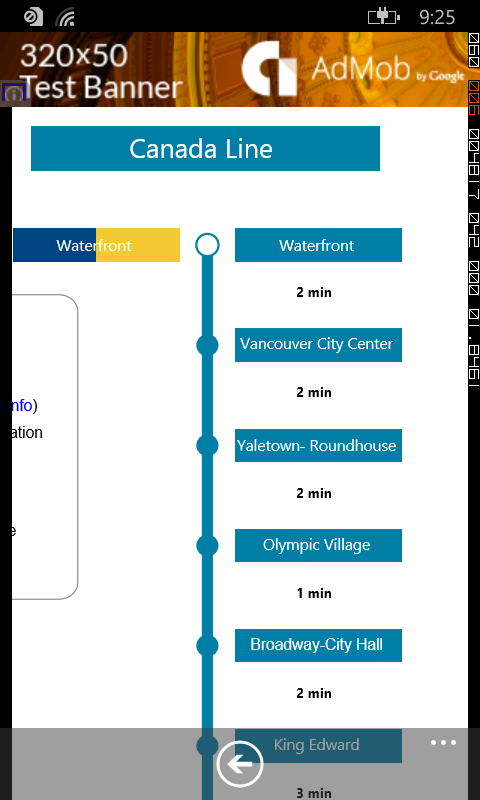
The app is also optimized for tablet sized devices. Both the list and the vector map are displayed at the same time, as shown below.

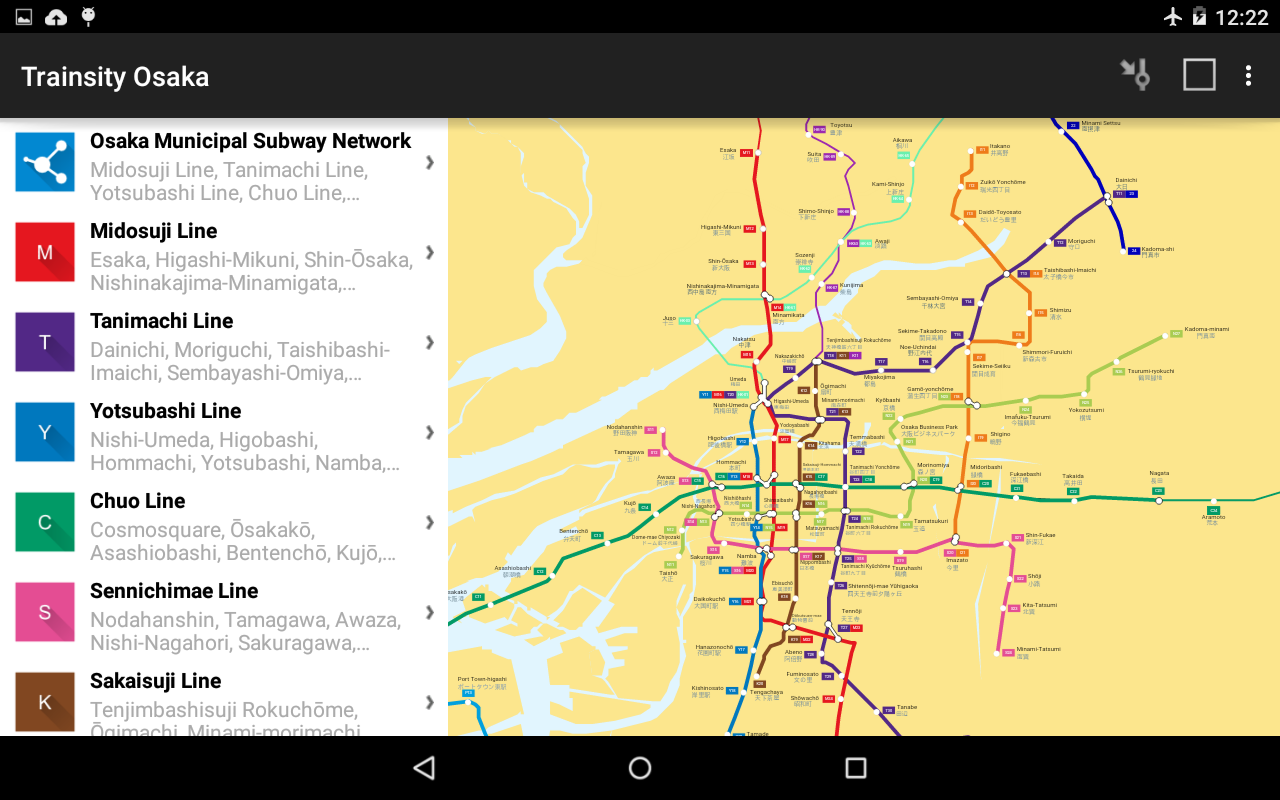
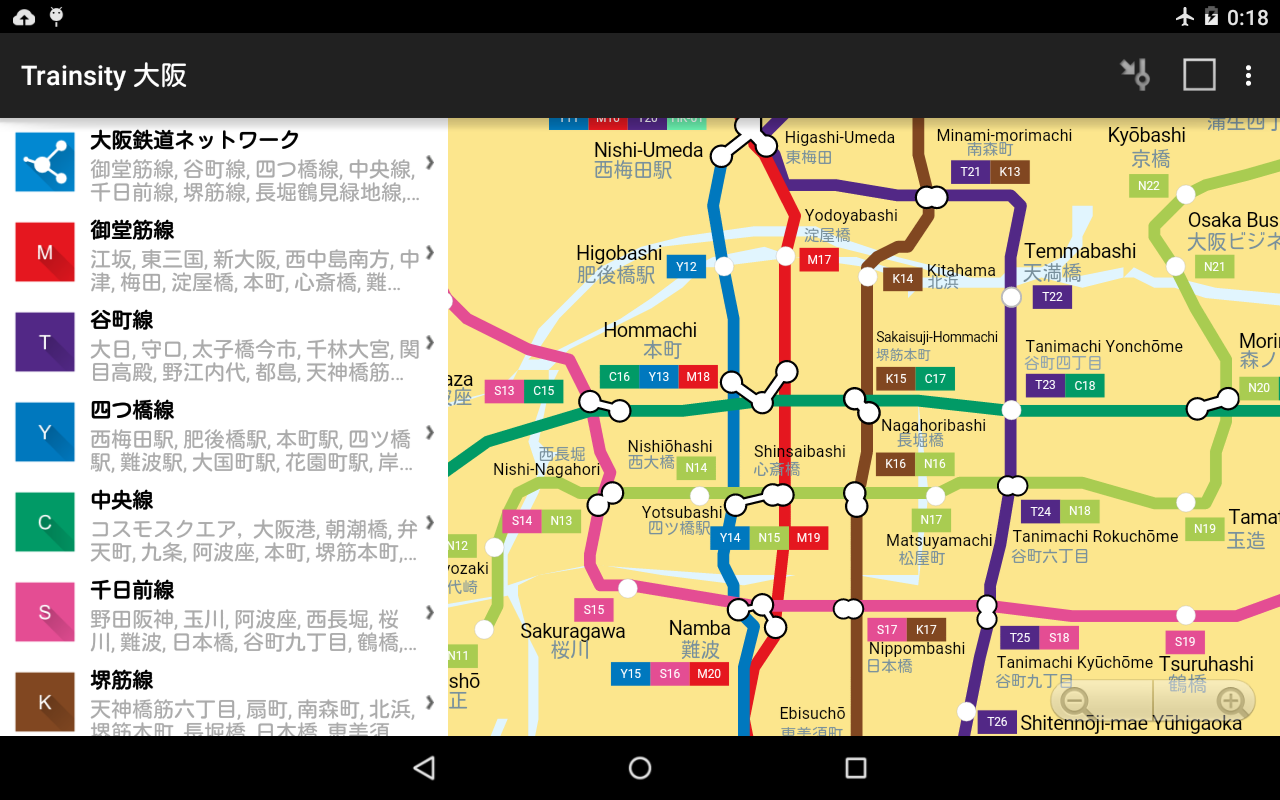
 The user can toggle the map to full screen mode by tapping the action bar icon at the top right corner.

The app can be downloaded from the Google Play Store. Just click the button below.
Get it on Google Play

Monday, December 15, 2014

Create a Colored Infra Red (CIR) image from a multi-channel RGBI TIFF file using ImageMagick

Some remote sensing imagery TIFF files contain multiple bands of data such as red, green, blue, and infra-red data. In order to visualize these bands, it is necessary to combine them into an RGB format such as what is called a Colored Infra Red (CIR) display. The open source software ImageMagick can be used to generate the CIR display from the multi-channel TIFF files.

This post illustrates how to create a CIR image from an input RGBI TIFF file. In order to generate a CIR image, the input channels - RGBI has to be reordered to IRG i.e.

  • the file's output red channel is replaced with the input Infra red channel, 
  • the output green channel is replaced with the input red channel, 
  • the output's green channel is replaced with the input green channel, 
  • and the input blue channel is essentially thrown away. 


The ImageMagick command to do this is quite simple, as shown below.

$ convert input_rgbi.tif -channel rgba -separate -swap 1,2 -swap 0,1 -swap 0,3 -channel rgb -combine output_cir.tif

Note: the sequence of options is important.

  • The option -channel rgba instructs the command to read in 4 channels.
  • The option -separate splits the input channels
  • The option -swap 1,2 swaps the 2nd and 3rd channels from RGBI to RBGI
  • The option -swap 0,1 swaps the 1st and 2nd channels from RBGI to BRGI
  • The option -swap 0,3 swaps the 1st and 4th channels from BRGI to IRGB
  • The option -rgb removes the 4th channel to become IRG
  • The option -combine merges all the 3 channels back
The input RGBI file (only the RGB channels are displayed)
The CIR image generated from ImageMagick

Monday, December 8, 2014

Correcting color cast problems in aerial photographs using curves in Gimp

In some cases, it may be necessary to correct color cast problems from aerial photographs due to atmospheric haze or sensor problems. An example of an image with a color cast problem is shown below. You can download the file from http://commons.wikimedia.org/wiki/File:Lakeside_Amusement_Park,_1966.jpg.


Note: aerial photograph courtesy of http://www.airlinesafety.com/editorials/AboutTheEditor.htm.

The Curves correction function in just about any image processing software can be used to easily correct the color cast problem. The open source application Gimp is used in this example.

The key to solving the problem is to use the fact that the color gray has the same RGB values. If a gray colored feature in the image e.g. an asphalt road has unequal RGB values, than the image has a color cast problem. To correct the problem, all you have to do is to get the RGB values for that gray point in the image to be the same using the Curves function.  It may be necessary to do the correction in the middle, dark and light tones. The following example illustrates how to correct the color cast problem.

  1. Start Gimp and open the aerial photograph. Optional. Make a duplicate layer of the image.

  2. If the Pointer window is not displayed, then select Windows | Dockable Dialogs | Pointer.

    Note: the circled area displays the RGB in pixel or percentage values.
  3. Move the pointer around the mid tone gray colored feature e.g. paved road, as shown in the screenshot below. Observe the RGB values in the Pointer window.

    Note: in this example, the RGB values are 142, 140, 189 or 55%, 55%, 74%. The numbers say that there is a blue cast in the mid tone values i.e. the blue values are too high and will have to be lowered. The red and green values are okay. 
  4. Select Colors | Curves.

    The Adjust Color Curves dialog box appears.
  5. Since blue is the problem color, select Blue in the Channel field. Then drag down the blue curve at around 189 pixel value as shown in the screenshot below. You can also move the cursor to the mid tone gray feature and check the new RGB values in the Pointer window. The correction is complete when the RGB values are about equal.

    Note: if the preview is toggled on, the effect of the changes will be displayed in the image window.
  6. In this example, the light tones do not seem to show much color cast. However, the dark tones don't seem to have enough red values as shown in the screenshot below. The dark area under the bridge show the RGB values of 1, 18, 17 or 0%, 7%, 7%.


  7. In the Adjust Color Curves dialog box, change the Channel to Red. Click a point in the middle of the curve to anchor the mid and light tone red values since the problem is only in the dark tones. Then drag the 0 pixel curve point up to 17 pixel value.

    Note: after every change, always move the cursor to the dark area and check the RGB values in the Pointer window.
  8. When the numbers and preview look pleasing, click OK to confirm the changes.

    The image shows the corrected colors.


    Contrast this to the original color casted version.

Monday, December 1, 2014

After adding an Android Library Module to a project, Android Studio does not launch the default app activity

I was following the official Android Studio documentation on building an Android project with Gradle but every time I run the app on my device, the activity for the library module kept on appearing no matter what changes I made to the app's default activity. The instruction added a button to the default activity and I was expecting a button to appear but what came out was as shown below.


The documentation did not mention anything about this. And after thinking through the problem, I figured that the Run configuration in the Android Studio needs to be told to run the app's activity. The following steps show how to change the Run Configuration.

  1. In Android Studio, select Edit Configuration.


    The Run/Debug Configuration dialog box appears.

  2. In the Activity group box, toggle on Launch. Then click browse [...].

    The Select Activity Class dialog appears.

  3. Select the desired app's activity e.g. MainActivity. Click OK.


  4. Click OK.
  5. In Android Studio, run the app again.

    This time, the correct activity with the added button appears.

Monday, November 24, 2014

Fixing Android Studio cannot resolve symbol R errors after an SDK update

Recently I updated an installation of the Android Studio beta to the latest Android SDK version on a workstation. Subsequently after the upgrade, the Android source project in the Studio will show error messages as shown in the screenshot below and all the R symbols in the editor would be highlighted in red when a new activity is added to the project. The console would be complaining about numerous unresolved resources e.g. "No resource found that matches the givent name 'android:TextAppearance.Material.Body2'".


The solution is to change the project settings to build using the latest Android SDK, as described below.

  1. In the Android Studio IDE, select File | Project Structure.

    The Project Structure dialog box appears.

  2. If not selected, choose the Project app module.
  3. Under the Properties tab, in the Compile Sdk Version field, choose the latest SDK .e.g API 21: Android 5.0 (Lollipop).


  4. In the Build Tools Version field, choose the latest version, e.g. 21.1.1.
  5. Click OK.

    The project is refreshed and the error messages no longer appear.

Monday, November 17, 2014

Trainsity Vancouver Windows Phone App

Find your way around metropolitan Vancouver's SkyTrain network using the high resolution vector maps of the Canada, Expo, and Millennium lines on a Windows Phone. The maps have small file size footprints but with many levels of zoom, and they can be viewed offline without any Internet connection. Users can click the train station labels to open the external Bing Maps app where they can use all the functions of the external app to visualize the surrounding area including querying for directions. This app has its own directions function for finding the best path from one train station to another.

On a Windows Phone handset, the app will display tiles of train lines, which when tapped will open up a detail view of the metro transit map, as shown below.

Tapping the station labels will bring up an option menu where users can choose to display the station location in Bing Maps.

If you want to find how long it takes to travel from one station to another, and the best route to take, simply swipe to the Route page. Then type in the From station and To station. As you enter the values, a drop down list will appear and a station can be selected from the list. Finally tap the Execute icon.
 
Tapping the more details link will display the recommended route to take.


 Click the button below to download the app from the Windows Phone store.

Monday, November 10, 2014

SVG template for creating Android Material Design product icons

Android Material Design has some guidelines for developers and designers to create product icons that reflect brand identity, as described in detail on this site http://www.google.com/design/spec/style/icons.html#icons-product-icons. As part of these guidelines, product icons can be based on certain keyline shapes in order to "maintain a consistent visual proportion across related product icons."

These keyline shapes include:

  • square
  • circle
  • vertical rectangle
  • horizontal rectangle. 

I did not find any downloadable resources of the keyline shapes to base the creation of new Android icons, so I created my own template in SVG format, at 4 times 48 pixels size, i.e. 192 pixels. The template looks as shown in the screenshot of Inkscape below.


Each keyline shape is placed on a separate layer.

Simply toggle on the desired keyline shape e.g. Horizontal rectangle in order to use it as a guide in creating new icons.


The SVG template can be downloaded from this site https://www.dropbox.com/s/3fhijfrf3zipnjm/mat_dgn_icon_template.svg?dl=0 if you want to use it.

Monday, November 3, 2014

Convert MultiLineString geometries to LineString using SpatiaLite SQL

Recently I made a mistake in creating a linear feature as a multi-line string instead of a plain line string geometry in SpatiaLite. I really did not want to digitize the features again so I decided to use SQL statements to convert the existing multi-line string geometries to line strings.

The following simple example shows how to do the conversion from a multi-line string table roads to a new line string table newroads. The basic steps involve (1) creating a new table, (2) populate the new table, (3) updating the new table with the line string geometry, (4) fixing the spatial metadata.
The table roads with the incorrect Multi-Line String geometry

Create a new table

  1. In SpatiaLite, type in the following SQL statement to create a new empty table newroads from the roads table. Execute the statement.

    CREATE TABLE newroads AS SELECT * FROM roads LIMIT 0

    A blank table is created with the same structure as the roads table.

Populate the new table with the textual attribute values
  1. In SpatiaLite, type in the following SQL statement to copy the rows (without the geometry field) from the original roads table into the new table newroads.

    INSERT INTO newroads(pkuid,name)SELECT pkuid,name FROM roads 
  2. Execute the SQL statement.

    All the rows are copied into the new table newroads.

    A simple query of the new table newroads show that all fields are populated with the exception of the geometry field, which remains as null.


Update the geometry field
  1. In SpatiaLite, type in the following SQL statement to form the SQL update statements to populate the geometry field.

    SELECT
    'UPDATE newroads SET Geometry='||'ST_GeomFromText('''||
    AsText(Geometry)||
    ''', 4326) WHERE pkuid='||
    pkuid||';' FROM roads


    Note: 4326 is the coordinate system reference used for the roads feature.
  2. Execute the statement.

    The update SQL statements are generated.

  3. In SpatiaLite GUI, click the grey area above and left of the resultant rows, as shown above.

    All the resultant rows are selected.
  4. Mouse right click on the selected rows.

    A pop up menu appears.

  5. Choose Copy.

    The resultant rows are copied to the OS Clipboard.
  6. In a text editor, paste the rows into a new file, e.g. demorun.sql.


  7. Change all occurrences of the string "MULTILINESTRING" to "LINESTRING".
  8. Change all occurrences of the string "((" to "(".
  9. Change all occurrences of the string "))" to ")".

    The statements should now look like the following example.

    UPDATE newroads SET Geometry=ST_GeomFromText('LINESTRING(-123.013367 49.328037, -122.980708 49.353917, -122.981324 49.386576, -122.975779 49.409992)', 4326) WHERE pkuid=1;
  10. Save the changes.
  11. In SpatiaLite, click the Execute SQL script button as shown below.


    The SQL Script Windows appears.

  12. Select the newly created SQL script file, e.g. demorun.sql. Click Open.

    The geometry field in newroads is updated.


Fix the spatial metadata
  1. In SpatiaLite GUI, mouse right click on the geometry field of the new table newroads.

    A pop up menu appears.

  2. Choose Recover geometry column.

    The Recover geometry column dialog box appears.
  3. In the SRID field, type in the coordinate system SRID value e.g. 4326.
  4. In the Dims field, choose the appropriate dimension of the geometry field, e.g. XY.
  5. In the Geometry Type list, choose LINESTRING.
  6. Click OK.

    The geometry field is recovered.