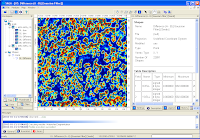
 It is possible to make a rough estimation of the number of trees in an area from LiDAR derived digital surface (DSM) and digital terrain models (DTM). One method is to use some of the grid analysis modules algorithm in SAGA GIS, such as Gaussian Filter, and Watershed Segmentation. Then simply count the number of segmented table records with height greater than a value.
The example here counts the trees using the following general steps:
- Load the DSM and DTM datasets
- Calculate the canopy heights
- Smooth the canopy heights
- Segment the canopy heights
- Count the number of segments with canopy heights above a certain value
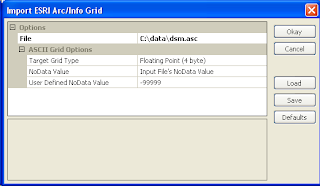
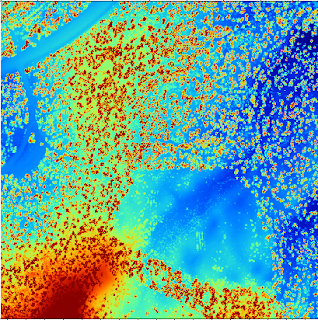
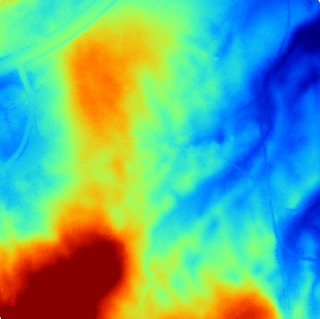
Load the source datasets
Calculate the canopy heights
- Select Modules | Grid | Calculus | Grid Difference.
The Grid Difference dialog box appears.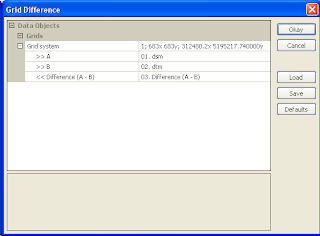
- In the Grid system field, choose the system of the source datasets, e.g. 683x 683y; 312480x 51952717y.
- In the A field, choose the digital surface model grid, e.g. dsm.
- In the B field, choose the digital terrain model grid, e.g. dtm.
- Click Okay.
The canopy height model grid is created. The default name is Difference(A-B).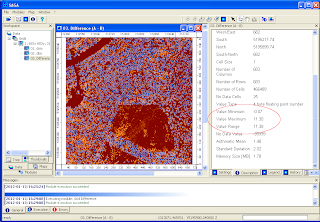
Smooth the canopy heights
- Select Modules | Grid | Filter | Gaussian Filter.
The Gaussian Filter dialog box appears.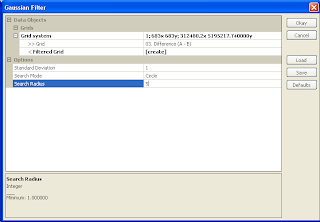
- In the Grid system field, choose the system of the source grids e.g. 683x 683y; 312480x 51952717y.
- In the Grid field, choose the canopy height grid, e.g. Difference (A-B).
- In the output Filtered Grid field, choose Create.
- In the Search Radius field, choose a value to approximate the tree radius e.g. 5.
- Click Okay.
The output smoothed grid is created. Default name is Difference (A-B) [Gaussian Filter].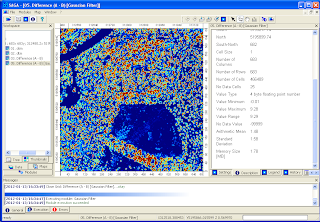
Segment the smoothed canopy height model
- Select Modules | Imagery | Segmentation | Watershed Segmentation.
The Watershed Segmentation dialog box appears.
- In the Grid system field, choose the source grid system e.g. 683x 683y; 312480x 51952717y.
- In the Grid field, choose the smooth canopy height grid e.g. Difference (A-B) [Gaussian Filter].
- In the Output field, choose Seed Value.
Note: since the segmentation will be run on the source grid of canopy height values, the resultant seed values will be the estimated heights of the tree tops. - Ensure the Method is set to Maxima.
Note: if set to Maxima, the watershed segmentation algorithm will start from the top (max) of the tree and flow down. - Optional. Toggle on Borders.
- Click Okay.
The segmented canopy height grid "Difference (A-B) [Gaussian Filter][Segments]" is created.
The canopy height point layer "Difference (A-B)[Gaussian Filter][Seed]" is created also.
Count the number of segments above a certain canopy height
- In the Data tree pane, right click on the newly created point layer node under the tree hierarchy - Shapes | Point | 01. Difference (A-B) [Gaussian Filter][Seed].
A pop up menu appears. - Choose Attributes | Show.
The attributes table is displayed.
- Right click on the VALUE header.
A pop up menu appears. - Choose Sort Fields.
The Sort Table dialog box appears.
- In the Sort first by field, choose VALUE.
- In the Direction field, choose descending.
- Click Okay.
The table is sorted.
- Scroll down the table to the rows with the VALUE greater or equal to 5.
The row number on the left indicates the rough estimate of the number of trees greater than 5 meters.
Note: instead of using SAGA GIS to do the counting with the tabular data, it may be easier to export out the point layer into a database software and perform the analysis there.

14 comments:
Thanks!!Great Tutorial!!
i can't use las file when i want to load in grid difference...Should I use asc file?
Hi Dominoc...
I have las file...
I can't convert las to asc format...
Could u tell how to convert it??
Hi Ar Musa
In Saga GIS, you can import LAS into vector points. Then run some interpolation and gridding algorithm to generate a grid layer.
I don't have Saga at hand but those are the general steps.
rg
In grid difference > grid system, I have to choose one from it, if I choose grid system A. I can only input A as dsm and dem. So I cannot input B as dem.
Now I'm successful, and this is my last question. Can I set the trees into UTM?
Hi Ar Musa
If your input is in UTM, then your results should be in UTM. Otherwise, you will have to reproject them into UTM. There is a Reproject module in SAGA to do that. You can also export out the points into Shapefiles and use your favorite GIS tool to reproject them, whichever is more convenient to you.
Thanks alot...now my dream comes true...hahahah
Sorry...I would like to ask once again..
When I crop Las file...automatically, cell size changed...no one similar
Now, every cell size have difference height...could you explain it? thanks
Hi Ar Musa,
Sorry I don't understand.
Hi Dominoc...
I prepared a DSM and DTM.tif and converted to .asc in qgis but only in black and white format. Otherwise it is showing three bands can not be converted in .asc. In that case what should I do to convert the colored format?
I am now facing problems with the protocol of saga GIS.
In grid> Calculus> grid difference, I have to choose DSM.asc as A and DTM.asc as B. Though the grid numbers are the same, it is coming two times when I am selecting the grid in grid difference and having a problem in choosing both data for A and B (I can input only one data for both A and B options).
I would be grateful if you could give me some suggestions.
Thanks
Try this https://wiki.tuflow.com/index.php?title=QGIS_Export_Raster_to_asc. Regarding your grid difference issue, are you sure both A and B have the same # of rows and pixels?
Hi dominoc, after getting your reply, I reproduced the DSM and DTM again to recheck if everything is okay or not. But still getting the same problem. Are there other factors that can create this kind of issues?
In order for the Grid diff to input both your DSM and DTM, they must have the same grid system i.e. same rows, pixels, origin, dimensions. That is why it asks for the grid system first. Then only grids that fit that grid system can be used as input choices.
Post a Comment