Monday, December 27, 2010

Standard terrain analysis in SAGA GIS

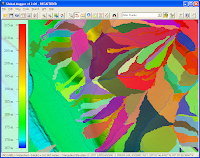
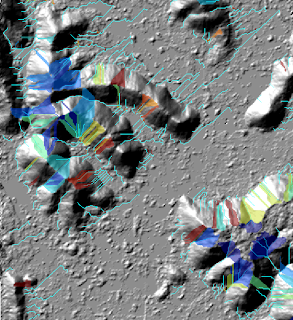
SAGA GIS has a convenient module to perform a number of standard terrain analysis functions at one go - the Standard Terrain Analysis module. It generates a number of grid layers of terrain related data including the slope, aspect, curvature, hill shading, and watershed basins among other layers, and a single vector layer of the watershed channel network. An example screenshot is shown below.


To use this module, a digital elevation model (DEM) file such as a SDTS file must be loaded into SAGA GIS and used as the source layer for the command.

Loading a DEM file

  1. Start up SAGA GIS.
  2. Select Modules | File | GDAL/OGR | GDAL : Import Raster.

    The GDAL: Import Raster dialog box appears.
  3. Select the Files row and click the browse button. In the Open dialog box that appears, choose a DEM file e.g. 9894CATD.DDF. Click Open.

    The selected file name is displayed in the Files field.
  4. Click Okay.

    The DEM file is loaded.
Performing the standard terrain analysis
  1. Select Modules | Terrain Analysis | Standard Terrain Analysis.

    The Standard Terrain Analysis dialog box appears.
  2. Select the Grid system row. Choose the previously loaded DEM layer's system, e.g. 30;384x 464y; 545765x 3831410y.
  3. Select the Elevation row. Choose the previously loaded DEM layer's name, e.g. 01.9894CATD.


  4. Click Okay.

    The standard terrain analysis is performed on the input DEM layer and the output grid and vector layers are created.

Viewing some of the resultant layers
  1. In the Workspace pane's Data tab, double click on a few layers e.g. 03.Analytical Hillshading, 18.Watershed Subbasins, 01. Channel Network.

    The Add layer to selected map dialog box appears.
  2. In the Map Selection list box, choose the same map for all layers so that they will overlay on each other. Click OK.

    The layers are displayed in the same map window.

Monday, December 20, 2010

How to obtain the Google Maps API key for Android

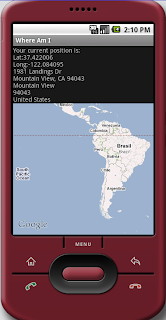
If you are developing on Windows with Eclipse, an API key needs to be obtained from Google if you want to embed Google's MapView control in your custom Android mobile phone app. An example application is shown in the figure below.

Assuming the preferences for the Eclipse development platform have not been changed from the default values, then following steps can be used.

Generate the Certificate Fingerprint 
  1. On Windows, open up a Command Prompt.
  2. In the Command Prompt window, use the cd command to change to the .android subdirectory underneath your "home" directory, e.g. C:\Documents and Settings\xxxx\ where xxxx is your user name.

    C:\> cd "\Documents and Settings\xxxx\.android"
  3. Type in the following keytool command.

    C:\> keytool -list -keystore debug.keystore

    Note: if the system PATH is not set with the Java Development Kit's bin folder, then the full path to the keytool executable in the JDK/bin/ directory need to be used. For example,

    C:\> "\Program Files\jdk1.6.0_18\bin\keytool -list -keystore debug.keystore

    The following prompt is displayed.

    Enter keystore password:
  4. Type in a password, e.g. android.

    The following information may be displayed.
    Keystore type: JKS
    Keystore provider: SUN

    Your keystore contains 1 entry

    androiddebugkey, Feb 2, 2010, PrivateKeyEntry,
    Certificate fingerprint (MD5): 94:1E:43:49:87:73:BB:E6:A6:88:D7:20:F1:8E:B5:98
  5. Note down the certificate fingerprint, e.g.  94:1E:43:49:87:73:BB:E6:A6:88:D7:20:F1:8E:B5:98.
Generate the API key
  1. Click this link to http://code.google.com/intl/ja/android/maps-api-signup.html
  2. Type in or paste the certificate fingerprint, accept the terms and conditions and click Generate API Key.

    The API key is generated.
  3. Copy this API key and use it in any Android layout.xml file that uses the MapView control.
An example layout.xml file is shown below:

<?xml version="1.0" encoding="utf-8"?>
<LinearLayout
  xmlns:android="http://schemas.android.com/apk/res/android"
  android:layout_height="fill_parent" android:layout_width="fill_parent" android:orientation="vertical">
  <com.google.android.maps.MapView
   android:id="@+id/map_view"
   android:layout_width="fill_parent"
   android:layout_height="fill_parent"
   android:enabled="true"
   android:clickable="true"
   android:apiKey="0Prelr1y0-DbJXwq7tIfLRwDLWTZb-MJA76FtYw"
  />
</LinearLayout>

Monday, December 13, 2010

Global Mapper's Add/Update Measurement attributes to line/polygon features

Calculating the linear or polygon geometry's measurement attributes such as length, perimeter or area can be done easily Global Mapper's Add/Update the Measure Attributes of Selected Features command. If the feature does not have the measurement attribute fields - Length, Perimeter or Enclosed Area, then the command will append them to the feature. Otherwise, the command will update the fields with the recalculated measurement values.
  1. Start up Global Mapper and open up a vector linear or polygon feature file.


  2. Click the Digitizer Tool .

    The cursor changes to a cross-hair with the Edit label.
  3. Using the mouse, click and drag to select one or more features.

    The features are selected.

  4. Press the mouse right button anywhere in the map display.

    A pop up menu appears.
  5. Choose Add/Update the Measure Attributes of Selected Feature(s).

    The selected features are updated and a message appears.
  6. Click OK.
To review the measure attributes of a feature, press ALT+P and click on any feature. This will bring up a Feature Information dialog box as shown below. Note the measure attribute fields Length.

Monday, December 6, 2010

Export a GeoMedia Access Warehouse to Postgis with GM2PGSQL

If you have been using Postgis for a while, you would be familiar with the shp2pgsql executable. This executable converts a shapefile into a Postgis SQL file for bulk loading into a Postgis database. There is a similar executable for converting a GeoMedia Access warehouse into Postgis. It is gm2pgsql, a free executable which is downloadable from this web site http://gm2pgsql.projects.postgresql.org/.

To use this executable,
  1. Type in the gm2pgsql command at the Windows Command Prompt.

    For example, input.mdb is the source GeoMedia Access warehouse, output.sql is the destination Postgis SQL file, pgdatabase is the destination Postgis database schema name, and -1 is the SRID number.

    C:\> gm2pgsql input.mdb output.sql pgdatabase -1
  2. Press RETURN.

    All the supported features in the Access warehouse are exported out.
If you open up the resultant SQL file with Notepad, the SQL statements to create the corresponding Postgis tables and corresponding feature attributes and geometries can be seen, as shown below. 
It seems that there is no way to limit the export to a single feature table; it will export all features that it recognizes. For more details, please visit the gm2pgsql project page at http://gm2pgsql.projects.postgresql.org/.

Wednesday, December 1, 2010

Free LAS viewer - PointVue LE

I found this free 3-D LiDAR LAS file viewer PointVue LE from GeoCue Corp., which can be downloaded from this link.


The free viewer provides you the capability to view only a single LAS file at a time in 3-D. It allows you to color the LiDAR points according to elevation, intensity, classification, return number, and source id. It does not have the capability to render the LiDAR points as surfaces or as contours though. There is also no way to cut a cross-section profile view of the data.


It has some basic functions to display the LAS file header and generate some statistical information about the data as shown below.


If you are looking for a simple LAS file viewer with reasonable visualization performance, PointVue LE may be what just you are looking for.

Monday, November 29, 2010

Auto-classifying LiDAR points as ground returns with MCC-LIDAR

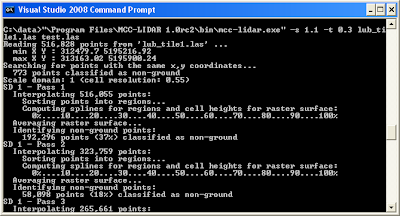
I tried out this free C++ program MCC-LIDAR downloadable from one of the SourceForge project sites. It is designed to classify LiDAR data points in LAS format as ground using the Multiscale Curvature Classification algorithm - hence the name MCC-LIDAR. Although the program is still in release candidate status, I found the output classification result to be surprisingly good, as shown in the sample shaded relief of the bare-earth surface screenshots below.


The program is a batch executable, meant to be executed from the Command Prompt. One of the difficult thing in using MCC-LIDAR is determining the two required numbers for the program - the scale (-s) and the curvature (-t) parameters.

Determining the scale parameter
For my sample LAS file, the way I went about it was to calculate the average point density for all returns, e.g. 1.107 points per square meter. Then invert the number and get the square root to get an initial scale parameter.
S = SQRT(1/1.107)= 1
You may have to vary the scale parameter number up or down by 0.1 and run the classification a few times to see which number gives the best result for the LAS dataset. In my test file, the best value was 2.0.

Determining the curvature parameter
I started out with 0.3 as my terrain seems relatively flat. I presume I would need a higher value if my terrain is more rolling. As before, it may be necessary to vary this number and examine the results for the best value. In my case, 0.3 was the best.

Running the classification
At the Windows Command Prompt, type in the following:
C:\>"\Program Files\MCC-LIDAR 1.0rc2\bin\mcc-lidar.exe" -s 2.0 -t 0.3 input.las output.las

Processing messages will appear... and the output LAS file is eventually created.

The profile view of the output classified LAS file is shown below. Note the classified ground points in purple.
And compare the screenshots below of the Digital Surface Model (DSM) with the classified results at the top of this page. They look almost as good as any output from any commercial program.


However, the MCC-LIDAR program can only classify ground points. It currently does not do anything to the non-ground points - it just retains the original point classifications; if it was Unclassified in the source LAS file, it will still be Unclassified in the output LAS file. It would be more useful it this program can classify the vegetation points as Low Vegetation class.

Thursday, November 25, 2010

Shift an entire layer with Global Mapper

Sometimes I have to provide sample geospatial data to vendors for product testing or for troubleshooting software problems. But I do not want to give them the actual location of the data, in which case I have to move the data away from the actual geographic location. Global Mapper provides a simple layer shift command to do this but it is hidden away in a pop up menu some where. To do this, do the following:

  1. Start up Global Mapper. Open up the file for shifting.


  2. If the Overlay Control Center is not displayed, press ALT+c.

    The Overlay Control Center is displayed.

  3. In the Overlay Control Center list box, mouse right click on the layer to shift.

    A pop up menu appears.

  4. Choose Shift Selected Layer(s) a Fixed Distance.

    The Specify Offset to Apply to Point(s) dialog box appears.

  5. In the X/Longitude Offset field, type in the horizontal offset, e.g. 1000.
  6. In the Y/Latitude Offset field, type in the vertical offset, e.g. 2000.
  7. Click OK.

    The layer is shifted.
  8. Save the layer. 

Monday, November 22, 2010

Monitor New Zealand Earthquakes with this Google Gadget


This gadget will allow you to subscribe to the New Zealand GeoNet real-time earthquake rss feed. It shows the latest earthquakes as color coded (by depth and age) icons with tool tips on a Google Maps backdrop - the older the earthquake, the more transparent the icon will look.

The gadget has a list tab which displays the earthquake information as a text list with hyperlinks for more details - the list can be sorted by the earthquake magnitude, depth as well as the date-time. Using the list, you can easily find and locate the largest, the latest or the deepest earthquakes.

You can leave this gadget on the screen and it will update itself as it receives the latest feed. Upon receiving the data, it will automatically zoom to the latest earthquake epicenter. Clicking on an earthquake icon will bring up more information about the earthquake from the GeoNet site.

Monday, November 15, 2010

A Google Gadget for monitoring natural disasters

You can use this gadget to monitor natural disasters around the world as published by the Global Disaster Alert and Coordination System (http://www.gdacs.org).

It shows the latest natural disasters like earthquakes, volcano eruptions, tropical cyclones, and floods as color coded icons with tool tips on a Google Maps backdrop; the icon colors indicate the alert level - green, orange, and red. The icon will look more transparent the older the event was published.

There is also a list view which can be used to sort the natural disaster events according to the date/time, region, and disaster type. Clicking on the icon will bring up more details about the disaster event.

Monday, November 8, 2010

Global Mapper 12's new Generate Watershed function

Global Mapper 12 was just recently released. A major enhancement was the inclusion of a terrain watershed creation function - the Generate Watershed command. I thought of trying out generating some drainage lines and basins on real LiDAR data. An example of the result is shown below.


Here are the steps I took to generate the watershed data.
  1. Start up Global Mapper 12 and load in a digital elevation model as shown below.

  2. Select File | Generate Watershed.

    The Watershed Generation Options dialog box appears.

  3. Change the X axis and Y axis Resolution if necessary.
  4. In the Depression Fill Depth field, type in a maximum depth value e.g. 1.

    Note: to turn off depression filling, enter 0.
  5. Click OK.

    Processing messages appear.

     
  6. If you want to generate the watershed basin polygons, then toggle on Create Watershed Areas Showing Drainage to Streams in the Watershed Generation Options dialog box. 

Monday, November 1, 2010

Split an area polygon with Global Mapper

Global Mapper has a rich set of editing tools but most of them are hidden away in pop up menus depending on the context. One of them is the Split Selected Area(s) at Selected Vertices command. As the name suggests, you can use this command to split one or more polygons. Here's how to use it.
  1. Start up Global Mapper. Either load in a polygon vector file or digitize a polygon such as the one shown below.


  2. By default, the vector vertices are not shown. Press SHIFT+v to display the vertices.


  3. Press ALT+d or click the Digitizer Tool  icon.

    The cursor changes to a cross hair with the label Edit.
  4. Press down CTRL and select the two vertices at the locations where you want to split.

    The selected vertices are highlighted in red.

  5. Now press the right mouse button.

    A pop up menu appears.

  6. Choose Split Selected Area(s) at Selected Vertices.

    The polygon is split into two parts.

Monday, October 25, 2010

Google Gadget for monitoring earthquakes (EMSC source)

This gadget will allow you to subscribe to the European-Mediterranean Seismological Center (EMSC) real-time, worldwide earthquake rss feed. It shows the latest 50 earthquakes as color coded (by depth and age) icons with tool tips on a Google Maps backdrop - the older the earthquake, the more transparent the icon will look. 

The gadget has a list tab which displays the earthquake information as a text list with hyperlinks for more details - the list can be sorted by the earthquake magnitude, depth as well as the date-time. Using the list, you can easily find and locate the largest, the latest or the deepest earthquakes for the past day. 

You can leave this gadget on the screen and it will update itself as it receives the latest feed. Upon receiving the data, it will automatically zoom to the latest earthquake epicenter. Clicking on an earthquake icon will bring up more information about the earthquake from the EMSC site.

Monday, October 18, 2010

Batch plotting pdfs from GeoMedia Professional's BatchPlot Utility

Intergraph did not include the capability to plot PDF files from the BatchPlot utility of GeoMedia Professional. Instead Intergraph recommend users to make use of Adobe Distiller to automatically convert any plot files generated by BatchPlot in a watch directory into PDFs.

I have a couple of alternative methods to create PDFs in batch mode. One of the methods involve the use of a free PDF printer called PDFCreator and which I shall describe here. It can be downloaded from this web site. Here is the procedure to use PDFCreator to create PDF files from BatchPlot.


By default, the PDFCreator installer creates a virtual printer with the name PDFCreator. The printer is automatically configured to create temporary PDF documents from any print job submitted to it; and the user will have to manually save the PDF document to a desired name and location. If BatchPlot submits a lot of print jobs to the PDFCreator printer, then manual saving would be quite troublesome. So it would be better if we enable the Auto-Save feature for the PDFCreator printer and define an output print folder.

Configure PDFCreator

  1. Select Start | All Programs | PDFCreator | PDFCreator.

    The PDFCreator - PDF Print monitor dialog box appears.
  2. Select Printer | Options.

    The Options dialog box appears.
  3. On the list on the left side, select Auto-save.
  4. Toggle on Use Auto-save.
  5. Toggle on Use this directory for auto-save.
  6. Click [...] and select a directory.

  7. Ensure After auto-saving open the document with the default program is toggled off.

    Note: by default, the PDF file is saved with the prefix {datetime}. I could not find a way to automatically name it from BatchPlot. So datetime is the best alternative.
  8. Click Save.
Use BatchPlot to submit print jobs to PDFCreator
  1. On the Windows Desktop, select Start | All Programs | GeoMedia Professional | Utilities | Batch Plotting.

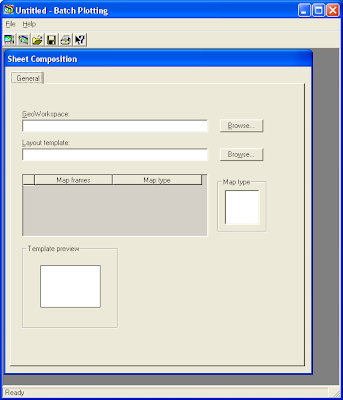
    The Batch Plotting dialog box appears.
  2. Select File | Open. Browse and choose a saved Batch Plotting File e.g. batchPlot.gbp. Click Open.

  3. Select File | Print.

    The Print dialog box appears.
  4. In the Name combo box, choose PDFCreator.
  5. Click OK.

    BatchPlot submits print jobs to the PDFCreator printer.


    The PDFCreator Print monitor shows the list of submitted print jobs.


    Finally, the PDF files are created in the output directory.


    The only problem with this method is that the PDF files must be renamed manually. Note that the plot order is in the same order as the order BatchPlot reads the map content features from the input warehouse - knowing this can help a little in renaming the files correctly