Tuesday, March 30, 2010

Getting the Primary Geometry Field Name from a GRecordset

As a GeoMedia programmer, it is necessary to be able to determine the primary geometry field name of a feature's GRecordset at runtime. The database field in the record set  that stores the feature geometry in a GeoMedia warehouse is typically named as Geometry1 but it is not always the case. Sometimes it can be simply Geometry or GDO_GEOMETRY or any name the programmers encoded into the application commands.

 If you are doing any programming using GeoMedia, then it is possible that at some point you would need to determine the primary geometry field name by code. You can use the ExtendedPropertySet class to directly read the primary geometry field name of record sets generated through the originating pipe object. Failing that, you can loop through all the fields of the record set to find the fields of type gdbSpatial or gdbGraphic. An example C# method is shown below:


        public static string GetGeometryFieldName(PClient.GRecordset rs)
        {
            string geomFieldName = string.Empty;
            PClient.ExtendedPropertySet exPropSet;
            PClient.GField field = null;
 
            exPropSet = (PClient.ExtendedPropertySet)rs.GetExtension("ExtendedPropertySet");
            geomFieldName = (string)exPropSet.GetValue("PrimaryGeometryFieldName");
 
            if (geomFieldName.Length == 0)
            {
                foreach (PClient.GField fld in rs.GFields)
                {
                    if (fld.Type == GDO.GConstants.gdbSpatial | fld.Type == GDO.GConstants.gdbGraphic)
                    {
                        geomFieldName = fld.Name;
                        break;
                    }
                }
            }
            if (exPropSet != null) Marshal.FinalReleaseComObject(exPropSet);
            if (field != null) Marshal.FinalReleaseComObject(field);
            return geomFieldName;
 
        }

Sunday, March 21, 2010

GeoMedia Grid's LiDAR Files to Text Files Utility

GeoMedia Grid 6.1.1 has one additional tool to work with LiDAR LAS files - the LiDAR Files to Text Files utility. As the name indicates, this utility will convert one or more LAS files into ASCII text files. If you find that converting LAS files to GeoMedia feature classes take too long and you have a lot of disk space, then you could use this utility to convert first to text files before creating native GeoMedia Grid *.mfm files. Besides creating the text files, this utility will also create the GeoMedia text server file definition file (*.tfd) for convenience. With this *.tfd file, you simply use the GeoMedia Warehouse Connection Wizard to connect to the LiDAR text files.

Here are the steps to use the LiDAR Files to Text Files Utility.
  1. From the Windows Desktop, select Start | All Programs | GeoMedia Grid | Utilities | LiDAR Files to Text Files.

    The LiDAR Files to Text File dialog box appears.
  2. Click Add. And choose a LiDAR LAS file.

    The selected LAS file is added to the Input LiDAR files list.
  3. In the Output text file name field, click Browse.

    The Save As dialog box appears.
  4. In the File name field, type in an output name. Click Save.

    The Apply button becomes enabled.
  5. Click Apply.

    The LAS file is converted into a text file and the LiDAR Files to Text File Log Summary is displayed.
  6. Click Close
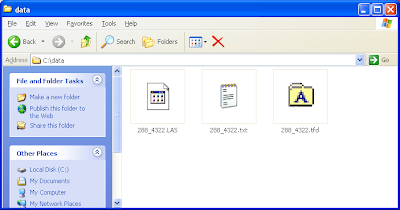
As shown below, besides the output text file a GeoMedia *.tfd file is also created.

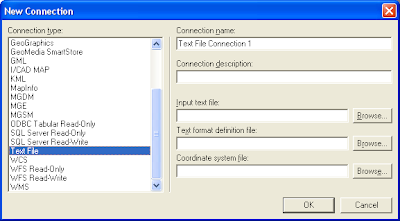
This *.tfd file can be used when you make a connection to the newly created text file with the Warehouse | New Connection command in GeoMedia as shown below.

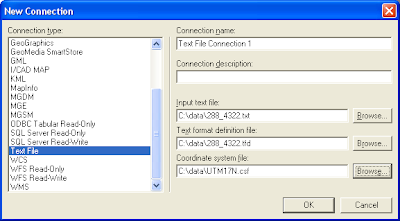
After filling in the input text file, text format definition file and the coordinate system file, the New Connection dialog box should like the figure below.

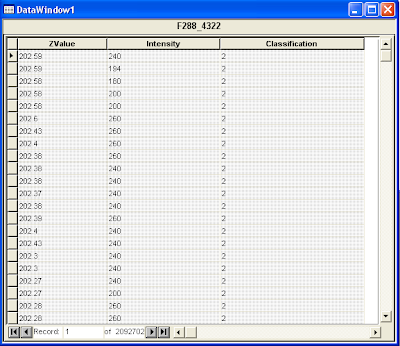
Once connected, the contents of the text file can be displayed in GeoMedia's Data Window.

Monday, March 15, 2010

Create LiDAR intensity GeoTiff images with FME

The raster transformers in FME can be used to create LiDAR intensity images in GeoTiff format. In my previous post, I created intensity images with the ImageRasterizer transformer but the resultant images are not that great. A better way is to form an intensity surface from the LiDAR points using the RasterDEMGenerator and generate the output GeoTiff intensity image. The detailed steps I did are described below.
  1. Start up the FME Workbench and open a blank workspace.
  2. Select Source Data | Add Dataset. Choose ASPRS Lidar Data Exchange Format (LAS) as the source format. Click Browse and choose a LAS file.

    The Add Source Dataset dialog box appears.

  3. Click OK.

    The Select Feature Types dialog box appears.

  4. Toggle off header and variable_length_header (optional). Click OK.

    The source dataset is placed on the workbench.
  5. Select Destination Data | Add Destination Dataset.

    The Add Destination Dataset dialog box appears.

  6. In the Format field, choose GeoTIFF. Click Browse and choose an output folder as the dataset. Click OK.

    The prompt appears.

  7. Click Yes.

    The Feature Type Properties appears.

  8. If you like, click the Parameters tab and define the output GeoTiff parameters e.g. compress method, world file generation etc. Click OK.

    The destination dataset is added to the workbench.
  9. Drag and drop the CoordinateFetcher, GeometryRemover, 3DPointAdder, RasterDEMGenerator, RasterInterpretationCoercer transformers onto the workbench. Connect them with the source and destination datasets as shown below.

  10. Open the CoordinateFetcher transformer's parameters and set as shown below.


  11. Open the 3DPointAdder transformer's parameters.Choose _x, _y, and Intensity as the X Value, Y Value and Z Value.


  12. Open up the RasterDEMGenerator's parameters. Type in the Output DEM X Cell Spacing and Y Cell Spacing e.g. 1.


  13. Open up the RasterInterpretationCoercer transformer's Parameters. Choose the Destination Interpretation Type e.g. Gray8. In the Convert from Numeric to Color field, choose Cast.


  14. Run the translation.

    The intensity GeoTiff file is created.
If you find the intensity image looks blown out (too many white spots), you can add in the ExpressionEvaluator transformer to adjust the intensity values before passing them into the RasterDEMGenerator transformer as shown below. 
In the ExpressionEvaluator's Properties, scale down the intensity values by multiplying with a factor e.g. 0.25 as shown below to ensure the values fit into the 8-bits grayscale range (0~255). I prefer using the ExpressionEvaluator than the RasterInterpretationCoercer to do this task as I wasn't too happy with the results from the Coercer's Numeric to Color parameter. 

Wednesday, March 10, 2010

Create a digital elevation model (DEM) from a LAS file with FME

I am quite impressed with the capabilities of the surface generation and raster manipulation transformers in FME. Coupled with the rich set of vector feature transformers, you could almost put together a terrain modelling and image processing package. I tried out generating a terrain model in ESRI ArcGrid ASCII format from a LiDAR LAS file and I am quite happy with the results. To do a simple transformation, just do the following:
  1. Start up FME Workbench and create an blank workspace. Choose Source Data | Add Source Dataset.

    The Add Source Dataset dialog box appears.

  2. Choose ASPRS Lidar Data Exchange Format (LAS) in the Format drop down list. In the Dataset field, click the Browse button and select a LAS file e.g. 288_4320.LAS. Click OK.

    The Select Feature Types dialog box appears.

  3. Toggle off header and variable_length_header (optional). Click OK.

    The source dataset is added to the workbench.
  4. Select Destination Data | Add Dataset.

    The Add Destination Dataset dialog box appears.

  5. In the Format drop down list, choose ESRI ASCII Grid. In the Dataset field, click Browse and choose an output folder e.g. C:\data. Click OK to close the Add Destination Dataset dialog box.

    A message appears to confirm the addition of a new feature type.
  6. Click Yes and OK to add a new Feature Type to the workbench.

    The destination dataset is added to the workbench.
  7. Drag and drop the RasterDEMGenerator transformer and connect the source and destination datasets with the transformer as shown below.


  8. Open up the RasterDEMGenerator Parameters. In the Output DEM X Cell Spacing and Output DEM Y Cell Spacing fields, type in a cell spacing value e.g. 1 as shown below. Click OK.


  9. Run the translation.

    The ESRI ASCII ArcGrid DEM file is generated and can be displayed in a terrain model viewer.

Friday, March 5, 2010

Create LiDAR intensity images using GeoMedia Grid

I tried to create LiDAR intensity images using GeoMedia Grid. It can be done interactively but I found the workflow to be quite tedious especially if you have a large number of tiles to handle. If you have a large number of intensity images to create, it would be more practical to automate the process either by developing a custom GeoMedia Grid program or use alternative software. To create the intensity images, here are the steps to do the job interactively.

Create a Study Area
  1. Start up GeoMedia and open up a geo-workspace and connect to a read/write warehouse with the appropriate coordinate system.
  2. Select Grid | Study Area | Define New.

  3. In the Coordinate Precision Key-in tool bar, type in the precise coordinate of one corner of the tile. Press RETURN.

  4. Type in the precise coordinate of the diagonally opposite corner of the tile. Press RETURN.

    The Define New Study Area dialog box appears.
  5. In the Study Area name field, type in the desired name. In the Cell resolution field, type in the output resolution e.g. 1 and set the units e.g. meters. Press OK.

    The study area is created.
Import a LAS tile file
  1. Follow the steps in my previous post to import a LAS file into the study area created previously.
Triangulate the tile by intensity values

  1. Select Grid | Study Area | List. Choose the previously created study area and imported LAS tile layer.

    The selected study area and layer are active.
  2. Select Grid | Interpolation | Triangulation.


    The Triangulation dialog box appears.
  3. Click Add.

    The Add Source Feature dialog box appears.
  4. In the Feature field, select the imported LAS tile layer in the current study area. Toggle on the Attribute Z-value. In the Attribute drop down list, choose Intensity. In the Units drop down list, choose None.

    The Add Source Feature dialog box may look like this at this point.
  5. Click OK.

    The Triangulation dialog box is updated.
  6. In the Output units field, select None. In the Result layer Name field, type in a meaningful name. Toggle off Place result in map window. Click OK.

    The result layer is created and added to the active study area.
Define the intensity gray scale range
By default, GeoMedia Grid will assign a grey scale color range to the result layer. Normally, the void or null values will be assigned as white. I prefer to color the voids as black. If you have only one tile, you might as well use the default. But if you have a number of tiles, then in order to ensure that all the tiles look the same, you have to create a grey scale xml file and reuse that xml file for all the tiles.
  1. In the Study Area List dialog box, right click on a layer.

    A pop up menu appears.

  2. Choose View Legend.

    The View Legend dialog box appears.

  3. Double click the box on the left of the VOID label as shown above.

    The color picker appears.

  4. Choose black.

    The View Legend(s) dialog box is updated.

  5. Click Apply.

    The color range is applied to the layer.

    Note: Click Save As to save the color range into an xml file. To reuse the xml file, simply click Load and choose the previously saved xml file.
  6. Click Close.

Create the intensity image as a GeoTiff file
  1. In the Study Area List dialog box, click on the newly created layer.
  2. Select Grid | Layer | Export to File.


    The Export to File dialog box appears.
  3. Click OK.

    The Save As dialog box appears.
  4. In the File name field, type in a name. In the Save as type drop down list, choose TIFF. Click Save.

    The Export to GeoTiff dialog box appears.
  5. Choose RGB or Grayscale. Click OK.

    The intensity GeoTiff image file is created.

Monday, March 1, 2010

Create the coverage shape file of flightline LiDAR data

It is useful to be able to visualize the coverage of the LiDAR data captured during an airborne flight especially for large survey areas. I found this tool lasboundary.exe from the free lastools toolkit to be quite useful to generate the coverage outline from the captured flight LiDAR data. The lasboundary executable generates a linear shape file from the LiDAR data points of the source LAS file by fitting a concave hull of all the points. I would have like it to generate the coverage as a polygon instead of a linear geometry but if I have the time, I might modify the executable to do just that. 

Using the lasboundary executable is easy as described below:
  1. In the Windows Command Prompt, to show the help just type in the following:

    C:\> lasboundary -h


  2. To generate the coverage, type in the following:

    C:\> lasboundary -i input.las -o coverage.shp


    The coverage shape file is created and can be displayed.