
Create a custom Surfer color table file
I have a specific slope color range from preexisting slope maps that I want to use to display the slope data, as shown below.

If I don't have the RGB values of the slope ranges above, then I can use an image editing program such as Photoshop or GIMP to sample each color separately to get the RGB values. I prefer to create the custom color file outside of Global Mapper using a text editor. However, it is also possible to use the Global Mapper's Custom Shader graphical user interface to do the same thing.
An example of how the color file looks like in Notepad is shown below.

The first line of "ColorMap 1 1" should not be changed. The data values and the corresponding RGB numbers follows.
For example, the line "0.000000 56 168 0" says the slope data value of 0.0 will have the darker green RGB color of 56, 168, 0. Then the next line "9.0 56 168 0" says the slope data value of 9.0 will have the same darker green RGB color of 56, 168, 0. These two lines define the color for the first slope range of 0 - 9 degrees. I repeat for the remaining slope ranges until I have completely defined the slope legend.
Display the slope grid data
- Start up Global Mapper and load in the ESRI ArcGrid ASCII file containing slope data.
The slope data is displayed in Global Mapper. Note the legend is showing the slope values as meters and hill shading is turned on.
- Click the shader drop down list. Choose Add Custom Shader as shown below.

The Custom Shader dialog box appears.
- In the Name field, type in a meaningful name, e.g. My Slope Shader. Click Initialize From Surfer CLR File. Browse and choose the color file created in the previous section. Click Open.
The color file is loaded and displayed in the Elevation Colors list box
Note: the buttons here can be used to graphically define the color ranges also instead of using a text editor like I did.
- Click OK.
The data is rendered with the new color scheme. - It may be necessary to turn off the hill shading in the rendering. Press ALT+C.
The Configuration dialog box appears.
- Click the Vertical Options tab. Toggle off Enable Hill Shading. Click OK.
The slope data is displayed without hill shading. Note the Elevation Legend is labeling the slope values as meters instead of degrees.


Customize the Elevation Legend.
- Right click anywhere on the Elevation Legend.
A popup menu appears.
- Choose Set Custom Elevation Units Display Text.
The Specify Display Unit Text prompt appears.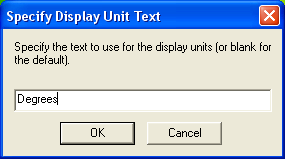
- Type in Degrees. Click OK.
The Elevation Legend correctly labels the slope values in degrees.


2 comments:
what a kickass blog!! I really like your article Man.... thank you very much for sharing this tips... since I really need it rite now... thank's!
i have a grid map (30m Arc/Info AscIII Grid) with each pixel having a specific unitless value. its neither elevation, slope, meter nor feet. however, global mapper identifies my map as an elevation map with continuous z-value. how can i change that so that global matter recognises each pixel as one unique value, and NOT as continuous value as in elevation or slope??
Post a Comment