Monday, April 25, 2011

Creating and displaying an interactive terrain profile in SAGA GIS

I found that creating and displaying a terrain profile with SAGA GIS 2.x a bit confusing. The documentation wasn't that useful. Later, I figured out that the Interactive Profile command will create a table containing the profile elevation points, and all I needed to do was to display those points.

Creating a terrain profile

  1. Start SAGA GIS. Load and display a DEM file in a Map window, e.g. ground.asc.


  2. Select Modules | Terrain Analyses | Profiles | Profile [interactive].

    The Profile dialog box appears.

  3. In the Grid system field, choose the grid system for the DEM, e.g. 1; 684x684y;312480x5195216y.
  4. In the DEM field, choose the DEM layer, e.g. 01.ground.
  5. Click Okay.
  6. Click the Action button.


    The cursor changes to a cross with the label i.
  7. In the Map window, click two or more points with the left mouse button.

    A blue line is placed between the clicked points.

  8. Mouse right click to complete the profile.

    The profile line and point shapes are created.
  9. Select Modules | Profile [Interactive] to exit from the command.


Displaying the profile as a table
  1. In the Data tab of the Workspace pane, mouse right click on the newly created point profile, e.g. 01.Profile[ground].

    A pop up menu appears.

  2. Choose Attributes | Show Table.

    The 01.Profile[ground] table is displayed.
Displaying the profile as a graph
  1. In the Data tab of the Workspace pane, mouse right click on the point shape e.g. 01.Profile[ground].

    A pop up menu appears.

  2. Choose Attributes | Show Diagram.

    The Properties dialog box appears.

  3. In the Attributes list, toggle on Z.
  4. In the X Axis list, choose the Values as defined by Distance.
  5. Optional. In the General list, choose the Display Type as Bars.
  6. Click Okay.

    The Diagram[01.Profile[ground] window appears showing the terrain profile.

  7. If necessary, click the Properties icon and change the properties again.


There doesn't seem to be any way for me to easily match the horizontal and vertical scales or to conveniently change the vertical exaggeration, among other things. But this is the closest thing I can find in SAGA GIS to a terrain profile. 

Monday, April 18, 2011

Join (or merge) polygons in gvSIG

Merging two or more polygons in gvSIG is simple to do. You have to make sure that the line work is topologically clean first i.e. no overlap and there must be coincident vertices. Otherwise, a compound geometry consisting of multiple polygons would be created instead.

The steps to join polygons are below:
  1. Start up gvSIG OADE 2010. Open a new View and add a polygon layer, e.g. polygons.shp.

  2. In the legend or table of contents, click on the polygons.shp layer name.

    The selected layer becomes the active layer.
  3. Select Layer | Start Editing.

    The legend name changes to red. The Command pane appears.
  4. Select Geometry | Select.
  5. Press CTRL and click on two or more polygons to join.

    The selected polygons fill color changes to red.
  6. Select Geometry | Modify | Join.

    The selected polygons are joined.
  7. Select Layer | Stop Editing.

    The prompt to save appears.
  8. Click Yes.

    The changes are saved.

Monday, April 11, 2011

Load and Display an ESRI ArcGrid ASCII file in gvSIG

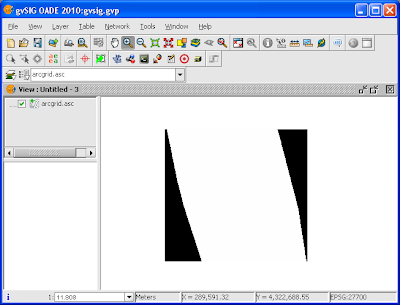
gvSIG can load and display DEMs in ESRI ArcGrid ASCII format. However, an ArcGrid file I loaded was displayed in gvSIG but the result was not what I expected. See the screen shot below.

After exploring the gvSIG interface, I figured out that the default void or no data value gvSIG was expecting was different from what I had in my ArcGrid ASCII file; it seems that gvSIG does not use the NODATA keyword in the ArcGrid file. To get around this, I had to change the void value gvSIG is expecting to match my data and all would be well.

If you find your DEM file is not displaying as you expected, then the following steps might help.

Load an ESRI ArcGrid ASCII file
  1. Start up gvSIG. Open a View.


  2. Select View | Add Layer.

    The Add layer dialog box appears.

  3. Click Add.

    The Open dialog box appears.

  4. Browse and select an ESRI ArcGrid ASCII file, e.g. arcgrid.asc. Click Open.

    The selected file is added to the Layers list.

  5. Click OK.

    The file is displayed in the view.
Changing the Void or No data value for the DEM layer
  1. In the legend or table of contents, select the arcgrid.asc layer.
  2. Mouse right click on the arcgrid.asc layer.

    A pop up menu appears.

  3. Select Raster properties.

    The Raster properties dialog box appears.

  4. Click the General tab.


  5. Click the No data drop down list. Choose Custom.


  6. In the No data Value field, type in -9999. Click Save as default.

    The Select an Option dialog box appears.

  7. Click Yes.
  8. Click Recalculate statistics.

    The statistics are updated. Notice that the Minimum does not show the -9999 void value anymore.

  9. Click Apply. Click Accept.

    The DEM is displayed in grey scale.
Change the Color table of a grid layer
  1. Mouse right click on the arcgrid.asc layer in the Legend/TOC.

    A pop up menu appears.

  2. Choose Color table.

    The Color table dialog box appears.

  3. Toggle on Activate color table.
  4. Choose a pre-defined scheme, e.g. elevation.


  5. Click Accept.

    The DEM is displayed with the selected color table.
Setting the Global Void or No data value


If I had to set the void value for many ArcGrid ASCII files, it would be quite tedious to do it file by file. It would be better to change the gvSIG preferences and set the global no data value as follows. 
  1. Select File | Preferences.

    The Preferences dialog box appears.

  2. Click Raster.
  3. In the No data value field, type in -9999 or any number which matches the void value for your DEM data.
  4. Click Accept.

    The change is saved.

Monday, April 4, 2011

Digitizing new polygons with gvSIG's Auto Polygon Tool

gvSIG has a rich set of GIS data creation and editing tools. There is the Auto Polygon command, which allows you to digitize polygons sloppily and it will automatically remove the overlapping parts of the new polygon. An example is shown below.
  1. Start gvSIG OADE. Open a new View. Add a polygon shape file layer, e.g. polygons.shp.

  2. In the legend, click the polygons.shp layer.
  3. Select Layer | Start Editing.

    The name color changes to red. The Command pane appears.
  4. Select Geometry | Insert | Auto Polygon.
  5. In the View, click three or more points to loosely place a polygon.

  6. In the Command pane, type in e. Press Return.

    The polygon is auto corrected for overlaps and created.
  7. Select Layer | Stop Editing.

    The Save prompt appears.
  8. Click Yes.

    The changes are saved.

If you examine the vertices of the new polygon and the existing polygon as shown below, you'd notice that the Auto Polygon command does not adjust the existing polygon at all. It does not create new nodes where the new polygon has vertices at the same location. The polygon layer might need to be processed through the gvSIG's Geoprocessing Tools to clean the geometries.