Monday, December 26, 2011
Google Gadget for monitoring crime incidents in Malaysia
This is a Google Gadget for monitoring crime incidents in Malaysia; the incidents are posted by users of www.malaysiacrime.com. The gadget works by subscribing to the georss feed of www.malaysiacrime.com site and displaying the incidents over a Google Maps backdrop. The crime incidents are icons color coded according to the categories - general, rempit, gun, parang, rape, and murder. There is also a list view which can be used to sort the crime incidents according to the date and time. Clicking on the icon will bring up more details about the crime incident.
Monday, December 19, 2011
Accessing PostGIS database features from gvSIG
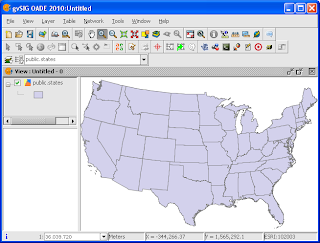
The PostGIS spatial database can be accessed by a variety of client software including gvSIG, FME, and even Intergraph's GeoMedia. It is possible to import features from GeoMedia into the PostGIS database and manipulated through an open source software like gvSIG. For instance, the example States feature in the screenshots below was imported to PostGIS via GeoMedia's Export Feature command.
In order for gvSIG to access and manipulate features in PostGIS, a GeoDB connection must be made first as shown below.
In order for gvSIG to access and manipulate features in PostGIS, a GeoDB connection must be made first as shown below.
- Start gvSIG OADE 2010. Create a new View with the desired coordinate system, e.g. Albers Equal Area. Open the view.

- Select View | Add Layer.
The Add Layer dialog box appears.
- Click the GeoDB tab.
- In the Connection field, click the New Connection button on the right.|
The Connection Settings dialog box appears.
- In the Connection name field, type in a name e.g. PostGISConn1.
- In the Driver field, choose PostGIS JDBC Driver.
- In the Server URL or IP field, type in the address name or the IP address e.g. 192.168.1.99.
- In the Database name field, type in the PostGIS database name e.g. gdotest.
- In the User field, type in the database user name e.g. gdouser.
- In the Password field, type in the password of the database user e.g. gdouser.
- Click OK.
If the values are correctly filled, the database would be connected to gvSIG. A list of tables appear.
- In the table list field, toggle on one or more spatial tables e.g. public.states.
- Click Ok.
The selected table(s) are displayed in the View.
Monday, December 12, 2011
Add your own property field to Google Maps polygons
The Google Maps Overlay classes such as the Polygon or Polyline classes have only standard properties including clickable, fillColor, paths, zIndex, etc. In certain circumstances, it is advantageous to extend the overlay classes to include additional user-defined properties such as the polygon title or road name so that the user-defined values can be retrieved when certain events occur - such as a polygon click event.
It is quite simple to extend the class to include your own properties as shown in the example code listing below. Simply add in the property and value when the overlay class is created.
The example code listing below shows how to extend a polygon to include a new property field named html It also illustrate how to retrieve the property value back when the polygon is clicked.
 //...etc...
 var contentString = "Hello world, this is my new attribute";
 //Create a new polygon with an additional user defined property: html
 var leftBot = new google.maps.LatLng(0,0);
 var leftTop = new google.maps.LatLng(2,0));
 var rightTop = new google.maps.LatLng(2,2);
 var rightBot = new google.maps.LatLng(0,2);
 var polyCoords = [leftBot,     leftTop, rightTop,     rightBot, leftBot];
 var poly = new google.maps.Polygon({
      html: contentString,
      paths: polyCoords,
      strokeColor: "#FF0000",
      strokeOpacity: 0.8,
      strokeWeight: 2,
      fillColor: "#FF0000",
      fillOpacity: 0
 });
 poly.setMap(map);
 //Add an on polygon click event handler to display the user defined property when clicked
 google.maps.event.addListener(poly, "click",
      function (evt){
           var contentString = this.html;
           var vertices = this.getPath();
           var xy = vertices.getAt(0);
           _infoWnd.setContent(contentString);
           _infoWnd.setPosition(evt.latLng);
           _infoWnd.open(map);
      }
 );
 //.... etc....
Monday, December 5, 2011
How to find out the digitized line directions in gvSIG
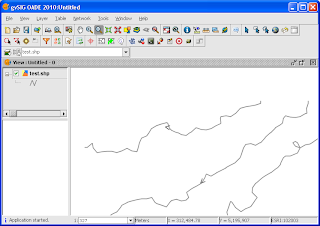
Sometimes it is useful to find out the direction the line work was digitized. It is possible to use the labeling function in gvSIG to display an indicator of the line direction as shown in the screenshot below.

The steps to label the line work with "direction" indicators are outlined below.

The steps to label the line work with "direction" indicators are outlined below.
- Start gvSIG OADE 2010. Open a map view and load in a line geometry file e.g. test.shp.

- In the legend (TOC) pane, click the line layer. Right click the layer name with the mouse.
A popup menu appears. - Choose Properties.
The Layer properties dialog box appears.
- Click the Labeling tab.
- Toggle on Enable labeling. In the General field, choose Advanced settings.
- In the Method field, choose the Label all features in the same way.
- Click the Placement button.
The Placement properties dialog box appears.
- In the Orientation group, choose Follow line.
- In the Position group, choose On the line. In the Orientation drop down list, choose Line.
- In the Along lines field, choose In the middle.
- Choose to Place one label per feature part. Click OK.
- Click the Properties button.
The Label class properties dialog box appears.
- Click the first row in the Label no. grid. Then click the [...] button.
The Expression dialog box appears.
- In the Expression field, type in "<". Click OK.
- Toggle on Label features in this class and choose All features. Click OK.
- Click OK.
The digitized line directions are indicated with the "<" character.
Subscribe to:
Comments (Atom)

