Monday, July 31, 2017

PDAL: Colorize a LAS file with multiple GeoTiff images

A LiDAR LAS file may not necessarily share the same bounds as a single raster image file. More often the case, to cover the LAS file more than one raster image file is needed. One way to resolve this is to merge all the raster images into a single mosaic file. Another way may be to keep the raster images as they are and load them in one by one (just-in-time fashion) to colorize the LAS file. This workflow is a little more complicated but it can be done using PDAL's pipeline processing mechanism.

In this post, PDAL will be used to colorize a LAS file using multiple tiles of GeoTIFF image files - four to be exact. You just need to create a pipeline that loads in the LAS file, apply the RGB values from each image file individually and write the colored points into an output LAS file. The following sections illustrate this workflow.

Here's how the source LAS and GeoTIFF files look like.
The source LiDAR LAS file displayed by elevation
The source GeoTIFF raster image files
Create a PDAL pipeline JSON file
  1. Using a text editor, type in the JSON syntax to colorize a LAS file using PDAL's colorization filter, as shown below.


    where
    uncompahgre.laz is the source LAS file,
    tile0.tif, tile1.tif, tile2.tif and tile3.tif are the source image files,
    and color.laz is the output LAS file name

  2. Save the text into a file e.g. colorLas.json.
A sample pipeline JSON is show in the listing below.

{
    "pipeline": [
        "uncompahgre.laz",
        {
            "type": "filters.colorization",
            "raster": "tile0.tif"
        },
        {
            "type": "filters.colorization",
            "raster": "tile1.tif"
        },
        {
            "type": "filters.colorization",
            "raster": "tile2.tif"
        },
        {
            "type": "filters.colorization",
            "raster": "tile3.tif"
        },
        {
            "type": "writers.las",
            "compression": "true",
            "minor_version": "2",
            "dataformat_id": "3",
            "filename":"color.laz"
        }
    ]
}

Run the colorization process

  1. Open up a OSGeo4W Command Prompt.
  2. At the prompt, type in the pdal pipeline command:

    c:\> pdal pipeline colorLas.json
    where colorLas.json is the pipeline JSON file created in the previous section.
  3. Run the command.

    Processing messages appear.


    The output colorized LAS file color.laz is generated.
  4. Optional. Display the resultant colored LAS file in a LAS Viewer.


Tuesday, July 25, 2017

Using Orfeo ToolBox to combine grayscale TIFF images into RGB and CIR composites

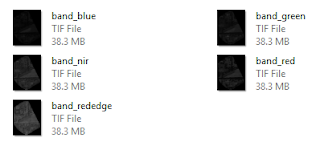
For working with geo-referenced TIFF images, Orfeo ToolBox (OTB) provides a useful convenience function otbcli_concatenateImages to combine separate grayscale images into a composite file. Examples of separate bands of grayscale images are shown below.

For instance, the separate grayscale bands representing the red, green and blue channels can be combined into a single RGB composite image. To do this using OTB, the following steps can be done.

  1. Open up a OSGeo4W Command Prompt.
  2. At the prompt, type in the otbcli_concatenateImages command with options:

    C:\> otbcli_concatenateImages -il band_red.tif band_green.tif band_blue.tif -out rgb.tif uint16

    where
    band_red.tif, band_green.tif, and band_blue.tif are the input files in the correct order,
    rgb.tif is the output RGB composite file
    uint16 is the output file datatype. By default it is float32 but that is too much. 
  3. Run the command.

    Processing messages appear. The bands are merged into the output file rgb.tif.
  4. Optional. Display the resultant file in a suitable viewer.

Similarly, to combine the separate grayscale bands into a composite Colored Infra-Red CIR file, the following steps can be done.

  1. Open up a OSGeo4W Command Prompt.
  2. Type in the otbcli_concatenateImages command.

    C:\> otbcli_concatenateImages -il band_nir.tif band_red.tif band_green.tif -out cir.tif uint16
    Where
    band_nir.tif, band_red.tif, and band_green.tif are the ordered input bands
    cir.tif is the output file name
    uint16 is the output file data type
  3. Run the command.

    Processing messages appear. The bands are merged into the output file cir.tif.
  4. Optional. Display the resultant file in a suitable viewer.


Monday, July 17, 2017

Use PDAL to generate a DEM from a LiDAR LAS file

PDAL can be used to generate a GeoTIFF digital elevation model (DEM) from a LiDAR point cloud LAS file via the GDAL writer driver. The resultant elevation GeoTIFF file may not be displayed as what is expected in some software such as Global Mapper because the PDAL generated file can have one or more bands of data including an alpha channel, depending on the PDAL options used; refer to https://www.pdal.io/stages/writers.gdal.html for the types of output bands that can be written to the DEM GeoTIFF file. For normal display, it might be necessary to separate the bands into individual files - in this post, the OTB (Orfeo Tool Box) otbcli_splitImage executable is used.

The following steps show how to generate a GeoTIFF DEM and split the resultant file into separate bands.

Generate the DEM

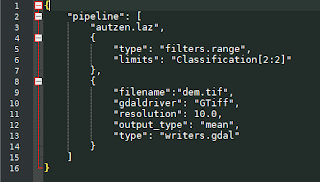
  1. Open up a text editor. Type in the following JSON text. Save the text into a file e.g. pdal_dtm.json


    Note: the JSON pipeline text will do the following:
    (a) Load in a LAS file e.g. autzen.laz
    (b) Filter away non-ground classified point
    (c) Write only the mean Z values to a GeoTIFF file dem.tif with a resolution of 10 meters

  2. Open up the OSGeo4W Command Prompt.

    The Command Prompt appears.
  3. Type in the PDAL command to process the pipeline. Run the command.

    C:\> pdal pipeline pdal_dtm.json

    The GeoTIFF file dem.tif is generated.
Splitting the bands

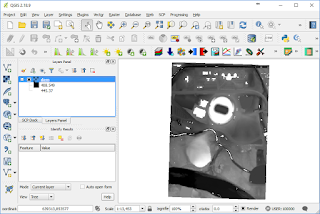
Displaying the resultant dem.tif containing only the mean Z band in QGIS will show something resembling a grayscale terrain with masked areas, as shown in the screenshot below.

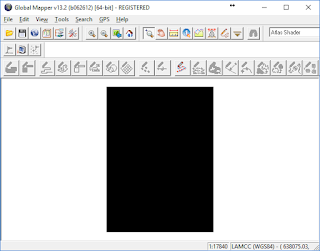
However, displaying the resultant GeoTIFF in Global Mapper will show a black rectangle, as shown below, due to the presence of an alpha channel. This need to be removed for proper interpretation of the elevation data.

To split the bands, do the following:

  1. In the OSGeo4W Command Window, type in the command:

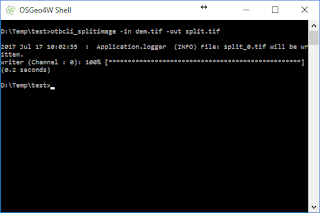
    C:\> otbcli_splitimage -in dem.tif -out split.tif


    The input file dem.tif is split into separate files with a numbered suffix starting from 0 e.g. split_0.tif.
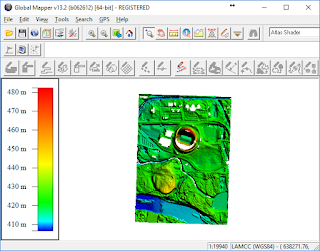
  2. Now, the file can be displayed properly in Global Mapper.

Wednesday, July 12, 2017

Applying a simple X,Y shift or translation to a raster GeoTIFF file using GDAL

Sometimes when comparing a raster ortho-mosaic GeoTIFF file to ground control points (GCPs), the raster file may appear to be slightly shifted relative to the ground control points. To resolve this problem correctly, it may be necessary to regenerate the ortho-mosaic after adjusting the tie points. But sometimes, if the shift is linear or you want to do a fast correction, then the open source software GDAL may be able to solve the problem for you.

To shift a raster GeoTIFF file e.g. input.tif with GDAL, do the following:

  1. Open up a Windows Command Prompt.
  2. Type in the gdal_translate command with the a_ullr option:

    C:\> gdal_translate -a_ullr 760726.437 4557390.415 772996.466 4540826.364 input.tif translate.tif

    Note: 
    translate.tif is the output filename
    -a_ullr specifies the new upper left X, upper left Y, lower right X, lower right Y coordinates  

  3. Run the command.

    Processing messages appear. The file is shifted to the new coordinates.


    The file is shifted to the new coordinates.