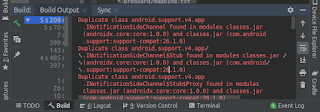
The screenshot below illustrates the error.

The solution I found was to set project wide gradle properties.


import React from 'react'
import Grid from '@material-ui/core/Grid'

// Start Openlayers imports
import {
    Map,
    View
 } from 'ol'
import {
    GeoJSON,
    XYZ
} from 'ol/format'
import {
    Tile as TileLayer,
    Vector as VectorLayer
} from 'ol/layer'
import {
    Vector as VectorSource,
    OSM as OSMSource,
    XYZ as XYZSource,
    TileWMS as TileWMSSource
} from 'ol/source'
import {
    Select as SelectInteraction,
    defaults as DefaultInteractions
} from 'ol/interaction'
import {
    Attribution,
    ScaleLine,
    ZoomSlider,
    Zoom,
    Rotate,
    MousePosition,
    OverviewMap,
    defaults as DefaultControls
} from 'ol/control'
import {
    Style,
    Fill as FillStyle,
    RegularShape as RegularShapeStyle,
    Stroke as StrokeStyle
} from 'ol/style'

import {
    Projection,
    get as getProjection
 } from 'ol/proj'

// End Openlayers imports

class OLMapFragment extends React.Component {
    constructor(props) {
        super(props)
        this.updateDimensions = this.updateDimensions.bind(this)
    }
    updateDimensions(){
        const h = window.innerWidth >= 992 ? window.innerHeight : 400
        this.setState({height: h})
    }
    componentWillMount(){
        window.addEventListener('resize', this.updateDimensions)
        this.updateDimensions()
    }
    componentDidMount(){

        // Create an Openlayer Map instance with two tile layers
        const map = new Map({
            //  Display the map in the div with the id of map
            target: 'map',
            layers: [
                new TileLayer({
                    source: new XYZSource({
                        url: 'https://{a-c}.tile.openstreetmap.org/{z}/{x}/{y}.png',
                        projection: 'EPSG:3857'
                    })
                }),
                new TileLayer({
                    source: new TileWMSSource({
                        url: 'https://ahocevar.com/geoserver/wms',
                        params: {
                            layers: 'topp:states',
                            'TILED': true,
                        },
                        projection: 'EPSG:4326'
                    }),
                    name: 'USA'
                }),
            ],
            // Add in the following map controls
            controls: DefaultControls().extend([
                new ZoomSlider(),
                new MousePosition(),
                new ScaleLine(),
                new OverviewMap()
            ]),
            // Render the tile layers in a map view with a Mercator projection
            view: new View({
                projection: 'EPSG:3857',
                center: [0, 0],
                zoom: 2
            })
        })
    }
    componentWillUnmount(){
        window.removeEventListener('resize', this.updateDimensions)
    }
    render(){
        const style = {
            width: '100%',
            height:this.state.height,
            backgroundColor: '#cccccc',
        }
        return (
            <Grid container>
                <Grid item xs={12}>
                    <div id='map' style={style} >
                    </div>
                </Grid>
            </Grid>
        )
    }
}
export default OLMapFragment
import React from 'react'
import { render} from 'react-dom'
import OLMapFragment from './js/components/OLMapFragment'

render(
    <OLMapFragment />
    ,
    document.getElementById('react-container')
)
<!DOCTYPE html>
<html class="no-js" lang="en">

<head>
    <meta charset="utf-8">
    <meta http-equiv="x-ua-compatible" content='ie=edge'>
    <title>Openlayers React</title>
    <meta name="description" content="Explore planet Mars">
    <meta name="viewport" content="minimum-scale=1, initial-scale=1, width=device-width, shrink-to-fit=no" />
    <!-- material-ui prerequisites -->
    <link rel="stylesheet" href="https://fonts.googleapis.com/css?family=Roboto:300,400,500,700&display=swap" />
    <link rel="stylesheet" href="https://fonts.googleapis.com/icon?family=Material+Icons" />
    <!-- end material-ui prerequisites -->

    <link rel="stylesheet" href="https://cdn.rawgit.com/openlayers/openlayers.github.io/master/en/v5.3.0/css/ol.css"
        type="text/css" />

</head>

<body>
    <!--[if lte IE 8]
        <p class="chromeframe">You are using an <strong>outdated</strong> browser. Please <a href="http://browsehappy.com">upgrade your browser</a></p>
        <![endif]-->
    <div id='react-container'></div>

</body>

</html>

| Layer | Url |
|---|---|
| Viking Color Mosaic - Global Map | https://api.nasa.gov/mars-wmts/catalog/Mars_Viking_MDIM21_ClrMosaic_global_232m/1.0.0//default/default028mm/{z}/{y}/{x}.jpg |
| CTX Mosaic - Curiosity Landing Site | https://api.nasa.gov/mars-wmts/catalog/curiosity_ctx_mosaic/1.0.0//default/default028mm/{z}/{y}/{x}.png |
| HiRISE Mosaic - Curiosity Landing Site | https://api.nasa.gov/mars-wmts/catalog/curiosity_hirise_mosaic/1.0.0//default/default028mm/{z}/{y}/{x}.png |
| HiRISE Mosaic - ESP_040776_2115 | https://api.nasa.gov/mars-wmts/catalog/ESP_040776_2115_RED_A_01_ORTHO/1.0.0//default/default028mm/{z}/{y}/{x}.png |
| HiRISE Mosaic - ESP_042252_1930_RED_B_01_ORTHO | https://api.nasa.gov/mars-wmts/catalog/ESP_042252_1930_RED_B_01_ORTHO/1.0.0//default/default028mm/{z}/{y}/{x}.png |
| HiRISE Mosaic - ESP_042647_1760_RED_B_01_ORTHO | https://api.nasa.gov/mars-wmts/catalog/ESP_042647_1760_RED_B_01_ORTHO/1.0.0//default/default028mm/{z}/{y}/{x}.png |
| HRSC Mosaic - Martian East | https://api.nasa.gov/mars-wmts/catalog/HRSC_Martian_east/1.0.0//default/default028mm/{z}/{y}/{x}.png |
| HRSC Color Mosaic - MC11 | https://api.nasa.gov/mars-wmts/catalog/MC11E_HRMOSCO_COL/1.0.0//default/default028mm/{z}/{y}/{x}.png |
| HRSC Mosaic - MC11 | https://api.nasa.gov/mars-wmts/catalog/MC11E_HRMOSND_ND5/1.0.0//default/default028mm/{z}/{y}/{x}.png |
| HiRISE Mosaic - Spirit Landing Site | https://api.nasa.gov/mars-wmts/catalog/spirit_hirise_mosaic/1.0.0//default/default028mm/{z}/{y}/{x}.png |
| HiRISE Mosaic - Opportunity Landing Site | https://api.nasa.gov/mars-wmts/catalog/opportunity_hirise_mosaic/1.0.0//default/default028mm/{z}/{y}/{x}.png |
| HiRISE Mosaic - Phoenix Landing Site | https://api.nasa.gov/mars-wmts/catalog/phoenix_hirise_mosaic/1.0.0//default/default028mm/{z}/{y}/{x}.png |
| HiRISE Mosaic - Sojourner Landing Site | https://api.nasa.gov/mars-wmts/catalog/sojourner_hirise_mosaic/1.0.0//default/default028mm/{z}/{y}/{x}.png |
| Albedo Mosaic - Thermal Emission Spectrometer | https://api.nasa.gov/mars-wmts/catalog/Mars_MGS_TES_Albedo_mosaic_global_7410m/1.0.0//default/default028mm/{z}/{y}/{x}.png |
| DEM Grayscale - Mars Orbiter Laser Altimeter | https://api.nasa.gov/mars-wmts/catalog/Mars_MGS_MOLA_DEM_mosaic_global_463m_8/1.0.0//default/default028mm/{z}/{y}/{x}.png |
| Color Hillshade - Mars Orbiter Laser Altimeter | https://api.nasa.gov/mars-wmts/catalog/Mars_MGS_MOLA_ClrShade_merge_global_463m/1.0.0//default/default028mm/{z}/{y}/{x}.jpg |
| Experience Curiosity - Curiosity Landing Site | https://api.nasa.gov/mars-wmts/catalog/mars_pahrump_patch_8k_256m/1.0.0//default/default028mm/{z}/{y}/{x}.png |
| Atlas Mosaic - Mars Orbiter Camera | https://api.nasa.gov/mars-wmts/catalog/msss_atlas_simp_clon/1.0.0//default/default028mm/{z}/{y}/{x}.png |
| Infrared Night - Thermal Emission Imaging System | https://api.nasa.gov/mars-wmts/catalog/Mars_MO_THEMIS-IR-Night_mosaic_60N60S_100m_v14_clon0_ly/1.0.0//default/default028mm/{z}/{y}/{x}.jpg |
| Infrared Day - Thermal Emission Imaging System | https://api.nasa.gov/mars-wmts/catalog/Mars_MO_THEMIS-IR-Day_mosaic_global_100m_v12_clon0_ly/1.0.0//default/default028mm/{z}/{y}/{x}.jpg |
| HRSC Mosaic - Mawrth Vallis | https://api.nasa.gov/mars-wmts/catalog/hrsc_mawrth_vallis/1.0.0//default/default028mm/{z}/{y}/{x}.png |
| HRSC Color Mosaic - Mawrth Vallis | https://api.nasa.gov/mars-wmts/catalog/hrsc_mawrth_vallis_color/1.0.0//default/default028mm/{z}/{y}/{x}.png |


