
- Load in the DSM and DTM grid datasets
- Calculate the canopy heights
- Smooth the canopy heights grid
- Segment the canopy heights
- Remove low canopy heights
- Convert the segments to vector polygons
Load the DSM and DTM grid datasets
- Start SAGA GIS. Load the DSM ArcGrid file e.g. C:\data\dsm.asc.
- Load the DTM ArcGrid file e.g. C:\data\dtm.asc.
Calculate the canopy heights
- Select Modules | Grid | Calculus | Grid Difference.
The Grid Difference dialog box appears.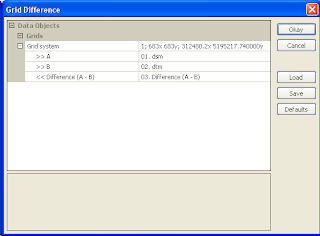
- In the Grid system field, choose the system of the source datasets, e.g. 683x 683y; 312480x 51952717y.
- In the A field, choose the digital surface model grid, e.g. dsm.
- In the B field, choose the digital terrain model grid, e.g. dtm.
- Click Okay.
The canopy height grid is created.

Smooth the canopy heights
- Select Modules | Grid | Filter | Gaussian Filter.
The Gaussian Filter dialog box appears.
- In the Grid system field, choose the system of the source grid e.g. 683x 683y; 312480x 51952717y.
- In the Grid field, choose the canopy height grid, e.g. Difference (A-B).
- In the output Filtered Grid field, choose Create.
- In the Search Radius field, choose a value to approximate the tree radius e .g. 5.
- Click Okay.
The smoothed canopy height grid is created.


Segment the smoothed canopy heights
- Select Modules | Imagery | Segmentation | Watershed Segmentation.
The Watershed Segmentation dialog box appears.
- In the Grid system field, choose the grid system of the smoothed grid layer.
- In the source Grid field, choose the smoothed grid layer e.g. Difference (A-B) [Gaussian Filter].
- In the Output field, choose Seed.
- Make sure the Method is set to Maxima.
- Click Okay.
The canopy heights grid layer is segmented according to maximum heights.


- Select Modules | Grid | Calculus | Grid Calculator.
The Grid Calculator dialog box appears.
- In the Grid system field, choose the system of the segmented layer.
- In the Grids field, click the browse button. In the Grids dialog box that pops up, double click on the segmented grid layer e.g. "Difference (A-B) [Gaussian Filter][Segments]". Click Okay.
- In the Formula field, type in the following: ifelse(lt(a,5),-99999,a).
Note: if the grid value is less than 5, then change the grid value to voids (-99999). - Click Okay.
The grid layer with no values below the height break limit is created.


Convert the segments into vectors
- Select Modules | Shapes | Grid | Vectorization | Vectorising Grid Classes.
The Vectorising Grid Classed dialog box appears.
- In the Grid system field, choose the system of the previously created grid layer.
- In the Grid field, choose the grid layer created in the previous step e.g. "Calculation [ifelse(lt(a,5),-99999,a)]".

- Click Okay.
The vector polygon layer is created. - Select the shape polygon layer in the Data tab. Then click the Description tab.
The number of shapes shows the approximate count of the number of trees above a height break limit.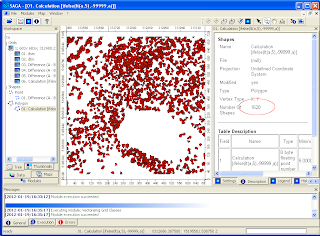
The polygons can be displayed as table attribute records as shown below.


3 comments:
Hey there!
Thank you so much for the knowledge shared. It helps me a lot.I have one question. Referring to the final output, values in the attribute table represent canopy height, am I right? I'm wondering if those values are the information for canopy/ crown size. Thanks!
Regards,
Ezit
Hi Ezit
the value should be the highest watershed height within the segmented polygon i.e. the canopy height in this case. An approximation of the crown size would be the radius/diameter/width of the segmented polygon.
Ok, got it! Thank you very much, sir. Once again, thanks a million for this very informative blog. =)
Post a Comment