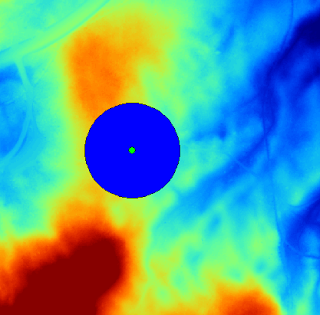
Load in a DEM grid layer and a point shape layer
- Start up SAGA GIS and load in and display a DEM grid layer, e.g. ground.asc.
- Load in and display a point shape file, e.g. bufferPoint.shp in the same map window.
The grid layer and point shape layer are loaded.
Create the buffer zone
- Select Modules | Shapes | Tools | Shapes Buffer.
The Shapes Buffer dialog box appears.
- Click the Shapes row and select the point shape layer e.g. 01.bufferPoint.
- In the Buffer Distance (Fixed) field, type in a distance, e.g. 100.

- Click Okay.
The buffer polygon is created around the point.
Generating the highest (and lowest) elevations for the entire DEM grid layer
- Select Modules | Shapes | Grid | Local Minima and Maxima.
The Local Minima and Maxima dialog box appears.
- Click the Grid system row and choose the DEM grid system, e.g. 1;684x684y;312480x5195216y.
- Click the Grid row and choose the input DEM grid layer, e.g. 01.ground.

- Click Okay.
The local minima and maxima point shapes for the entire DEM grid layer are created.
Finding only the local maxima point shapes within the buffer
- Select Modules | Shapes | Construction | Cut Shapes Layer.
The Cut Shapes Layer dialog box appears.
- Click the Shapes row. Then click the browse [...] button.
The Shapes dialog box appears.
- Select the local maxima point shape layer, e.g. 03.ground[Local Maxima] on the left list. Click the >> button.
The selected layer is shifted to the right list. - Click Okay.
- Ensure the Method is completely contained. Click the Options Extent row and select polygons.

- Click Okay.
Processing messages appear.

The Polygons dialog box appears.
- Click the Polygons row and choose the buffer shape layer, e.g. 01.bufferPoint[Buffer].

- Click Okay.
The local maxima points within the buffer is generated.
Locating the maximum point within the buffer
- In the Workspace pane, mouse right click on the local maximum points within the buffer layer, e.g. 04.ground[Local Maxima][Cut].
A pop up menu appears.
- Select Attributes | Show Table.
The attribute table appears. - Select Window | Tile Horizontally.

- In the attribute window, double click the Z column title header to sort the records so that the maximum Z value is the first row.
- Select the first row (which has the maximum elevation).
The corresponding point on the map window is highlighted.

No comments:
Post a Comment