Monday, December 30, 2013

Measure geodesic distances on Google Maps

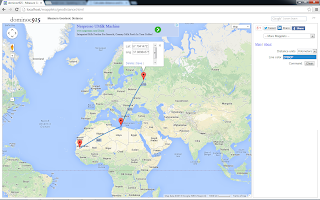
As the name suggests, this Measure Geodesic Distance mapplet allows users to measure the geodesic distance between two or more points on the earth's surface using the Haversine formula. The mapplet uses the formulas from this site http://www.movable-type.co.uk/scripts/latlong.html. The measurement points and lines are displayed on a Google Maps backdrop. Users have the option to choose the measurement units of meters, kilometers or miles: the line color can also be set by the user.

Run the mapplet from this site http://dominoc925-pages.appspot.com/mapplets/geodistance.html

Using the mapplet is easy, just do the following:

  1. Click two or more points on the map.

    Vertex markers are displayed, and geodetic lines are displayed between the vertex markers.
    Note I : the segment distance value is displayed at the mid point of the line(s).
    Note II: the total distance value is displayed at the last vertex marker. 

  2. Drag a vertex marker to another location on the map.

    The geodetic lines and vertex markers are updated to show the new distances.

  3. Click on a vertex marker.

    The latitude and longitude values are displayed in an Info Window.
  4. In the Info Window, click Delete to delete the vertex marker.

    The vertex marker is removed and the lines and markers are updated to show the new distances.
  5. To adjust a vertex marker by precision key-in, click on a vertex marker.

    The latitude and longitude values are displayed in an Info Window.
  6. In the Info Window, type in the new latitude and/or longitude values. Click Save.

    The vertex marker is moved to the new location and the lines and markers are updated to show the new distances.
  7. To clear all the markers and lines from the map, click the Clear button in the right pane


Monday, December 23, 2013

Seattle 911 incidents monitoring WebApp

This WebApp allows users to monitor the City of Seattle's Fire Department's real time 911 dispatches (updated every five minutes) and the Seattle Police Department's 911 dispatch incident responses that are non-confidential (updated every 4 hours) on a Google Maps backdrop. Simply choose the appropriate feed on the 911 feed drop down menu on the right pane.


The 911 incidents are shown as clickable icons with tool tips on Google Maps. Clicking on an icon will bring up more details about the incident. Users can utilize additional built-in Google Maps features such as Street View, or 3-D oblique 45 degrees views to immerse themselves into the incident environment.


The 911 incidents are also shown as a list on the right pane. The list can be sorted by incident category, date-time and address - either in ascending or descending order. Clicking the Maps hyperlink will automatically locate, zoom, and center the incident in the Map view.

The WebApp can be launched from this link http://dominoc925-pages.appspot.com/webapp/seattle911mon/default.html

Monday, December 16, 2013

How to obfuscate an Android APK file using ProGuard in the Eclipse ADT

The classes in the Android APK can be obfuscated using the ProGuard tool in the Android Development Toolkit (ADT) in Eclipse. The following shows how to enable to source code obfuscation.
  1. In Eclipse, open up an Android project e.g. androidgames.
  2. Open up the file project.properties in the Eclipse text editor.


  3. Uncomment the following line by removing the # symbol in the first column.

    #proguard.config=${sdk.dir}/tools/proguard/proguard-android.txt:proguard-project.txt
  4. Optional. If there are any classes that you do not want to obfuscate, then the class must be added to the proguard-project.txt file, e.g. com.dom925.trains.manila.SvgInterface, as shown below.
# If your project uses WebView with JS, uncomment the following
# and specify the fully qualified class name to the JavaScript interface
# class:
#-keepclassmembers class fqcn.of.javascript.interface.for.webview {
#   public *;
#}
-keepclassmembers class com.dom925.trains.manila.SvgInterface {
public *;
}

An example of a decompiled obfuscated Android APK is shown below.

Monday, December 9, 2013

How to decompile an Android APK file

I was wondering how easy it is to decompile my Android APK files into source code files. So I did some searching using Google Search and found a few decompilers, some free and some commercial stuff. It seems that the process can be done in two steps: (1) convert the APK file to a JAR file, and (2) convert the JAR file to JAVA files.

The first step can be done using open source program dex2jar from https://code.google.com/p/dex2jar/downloads/list. The second part can be done using a Java decompiler from http://jd-gui.softpedia.com/. The Java decompiler will decompile the JAR file into the Java source code files. Using these two programs, it was very easy to reverse engineer the Android APK file as shown below:
  1. Open up a Command Prompt.
  2. Type in the d2j-dex2jar.bat command (assuming it is in the system path, otherwise you need to type in the whole command path) to convert an apk file e.g. androidgames.apk.

    C:\> d2j-dex2jar.bat androidgames.apk

    The apk file is converted to a jar file androidgames-dex2jar.jar.

    Note: the suffix "-dex2jar.jar" is appended to the file name.
  3. Now run the Java decompiler jd-gui.exe by double clicking the executable from the Windows Explorer.

    The Java Decompiler application appears.

  4. Click File | Open File. Browse and select the jar file created previously.


  5. Click Open.

    The classes and source code files are displayed in the application.


Monday, December 2, 2013

Find your way around Kuala Lumpur with this Android App: Trainsity Kuala Lumpur

Find your way around the city of Kuala Lumpur using the high resolution vector maps of the KTM Komuter lines, RapidKL lines, and KLIA Express Rail Link lines. The maps have small file size footprints but with many levels of zoom and can work offline without connecting to the Internet. Users can click the train station labels to open Google Maps, where they can use all the functions of the Google app to visualize the surrounding area and/or perform routing for directions.

On a mobile handset, the app will display a list of train maps, which when tapped will open up a detail view of the metro transit map, as shown below.


Tapping the station boxes will bring up an option menu where users can choose to display the station in Google Maps.


The app is also optimized for tablet sized devices. Both the list and the vector map are displayed at the same time, as shown below.


The user can toggle the map to full screen mode by tapping the action bar icon at the top.

The app can be downloaded from the Google Play Store 
Get it on Google Play

Monday, November 25, 2013

Find dangles using QGIS

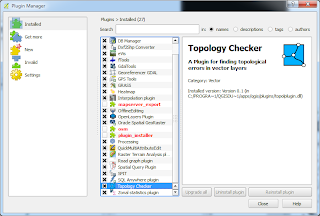
QGIS Desktop 2 has a easy to use plug-in - Topology Checker, that can be used to identify dangles in linear features. If it is not installed, then it is a simple matter to use the Plug-in Manager to download and install it, as shown below.


Using the Topology Checker to find dangles is straightforward. Just choose the linear feature layer and define the validation rule(s), and run it. An example usage is illustrated below.

  1. Start QGIS 2. Load and display a linear feature layer e.g. segments.


  2. Select Vector | Topology Checker | Topology Checker.

    The Topology Checker pane appears on the right.

  3. In the Topology Checker pane, click Configure.

    The Topology Rules Settings appear.

  4. In the Current Rules first drop down combo box, choose a linear feature e.g. segments.

    The second and/or third combo boxes are enabled.

  5. In the second combo box, choose a validation rule e.g. must not have dangles. Click Add Rule.

    The rule is added to the list.

  6. Click OK.
  7. In the Topology Checker pane, click Validate All.

    The dangles are listed.

  8. In the list, select one error.
    The dangle is highlighted and centered in the map.
Monday, November 18, 2013

Simple shortest path analysis using QGIS Road Graph plug-in

There is a Road Graph plug-in that can be installed in QGIS, and used to perform directional and non-directional shortest path analysis. Using the plug-in is quite straight forward, provided the network data is available and topologically clean. The following is an example showing a non-directional shortest path calculation using a linear metro network layer from a SpatiaLite database but it could from any GIS format.

  1. Start up QGIS 2. Load and display a linear network layer e.g. segments.


  2. Select Vector | Road Graph | Settings.

    The Road graph plugin settings appear.

  3. In the Layer field, choose the linear network layer e.g. segments.
  4. Optional. In the Time unit field, choose the time units to report on e.g. minutes.
  5. Optional. In the Distance unit field, choose the distance units to report on e.g. meter.
  6. Optional. In the Topology tolerance field, type in a non-zero value, if there are gaps in your linear network. Leave it zero if your network is topologically clean.
  7. Click the Default settings tab.


  8. In the Direction field, I chose Two-way direction as my network is bi-direction.
  9. Click OK.
  10. In the Shortest path pane's Start field, click the "cross" button.


  11. Click a starting point of the analysis in the map.
  12. In the Shortest path pane's Stop field, click the "cross" button. Click the ending point in the map.
  13. In the Criterion field, choose Distance.
  14. Click Calculate.

    The shortest path by distance is calculated and displayed in the map.

Monday, November 11, 2013

Split a polygon feature with a digitized line in QGIS

It is possible to split a polygon feature by interactively drawing a line over it in QGIS 2.0 with the Split Feature command. The command doesn't seem to be accessible from the menus and only available as a tool bar item in the Advanced Digitizing tool bar palette. The following shows how to access it to split a polygon.

  1. Start QGIS 2.0. Load and display a vector layer e.g. mask.shp.


  2. Select View | Toolbars. Toggle on Advanced Digitizing.


    The Advanced Digitizing tool bar is displayed.

  3. In the Layers pane, select the polygon layer. Then select Layer | Toggle Editing.

    The polygon layer is enabled for editing.
  4. Click the Split Feature icon.


  5. Digitize a line over a polygon feature.


  6. Right click to complete the line.

    The polygon feature is divided into parts according to the digitized line.

  7. To make the change permanent, toggle off Editing mode.

Monday, November 4, 2013

Burn or rasterize vectors onto GeoTiff images

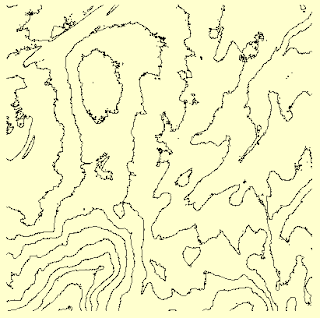
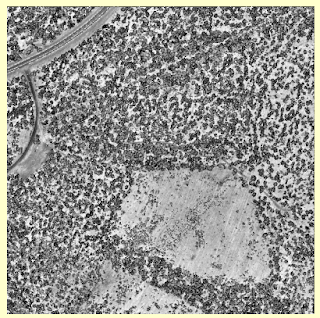
Once a while I get an unusual request like burning contour vector lines onto GeoTiff images. It's a good thing the open source software GDAL has a gdal_rasterize utility to do the job. Here is an illustrated example of burning vector lines onto a raster image.
Input vector contour lines
Input raster GeoTiff file


  1. Open up a Windows Command Prompt.
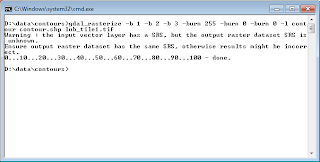
  2. Type in the following command, (assuming the GDAL installation bin folder is in the system path).

    C:\> gdal_rasterize -b 1 -b 2 -b 3 -burn 255 -burn 0 -burn 0 -l contour contour.shp lub_tile1.tif

    Note 1: -burn 255 -burn 0 -burn 0 means burn the RGB color values (255, 0, 0).
    Note 2: -b 1 -b 2 -b 3 means to use the three bands of R, G, and B.
    Note 3: this utility will overwrite the input raster file, so make sure there is a backup copy of the file.


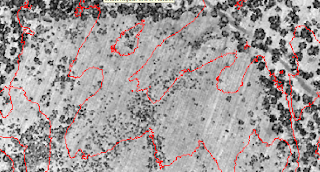
    The contour.shp vector lines are burned onto the GeoTiff file lub_tile1.tif.

Monday, October 28, 2013

Trainsity Bangkok Android App

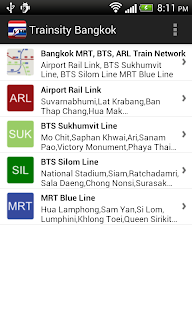
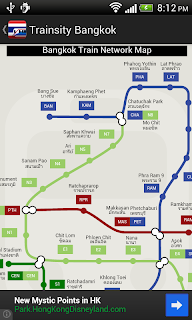
Find your way around the city of Bangkok using the high resolution vector maps of the Bangkok Sky Train ( BTS), Metro (MRT) and Airport Rail Link train network. The maps have small file size footprints but with many levels of zoom and can work offline without connecting to the Internet. Users can click the train station labels to open Google Maps or Google Street View, where they can use all the functions of the Google apps to visualize the surrounding area and/or perform routing for directions.


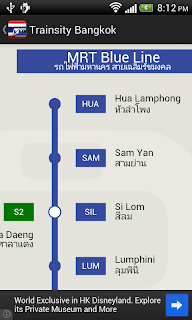
On a mobile handset, the app will display a list of train maps, which when tapped will open up a detail view of the transit map, as shown below.

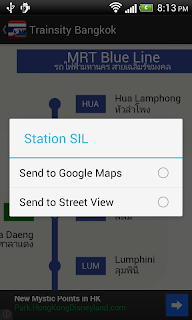
Tapping the station boxes will bring up an option menu where users can choose to display the station either in Google Maps or Street View.


On a tablet sized device, the app will display both the list and the detail map view, as shown below.

  If desired, the user can toggle the map to full screen mode by tapping the action bar icon.
The app can be downloaded from the Google Play Store.
Get it on Google Play