Monday, October 28, 2013

Trainsity Bangkok Android App

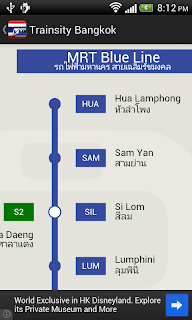
Find your way around the city of Bangkok using the high resolution vector maps of the Bangkok Sky Train ( BTS), Metro (MRT) and Airport Rail Link train network. The maps have small file size footprints but with many levels of zoom and can work offline without connecting to the Internet. Users can click the train station labels to open Google Maps or Google Street View, where they can use all the functions of the Google apps to visualize the surrounding area and/or perform routing for directions.


On a mobile handset, the app will display a list of train maps, which when tapped will open up a detail view of the transit map, as shown below.
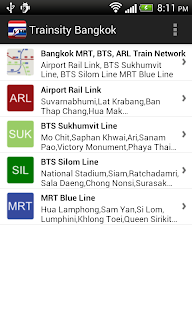
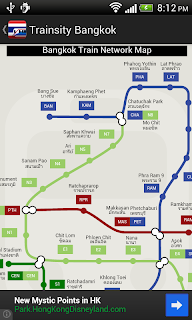
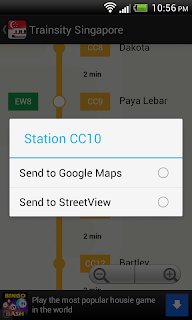
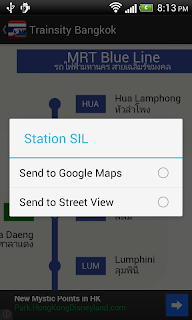
Tapping the station boxes will bring up an option menu where users can choose to display the station either in Google Maps or Street View.

On a tablet sized device, the app will display both the list and the detail map view, as shown below.

  If desired, the user can toggle the map to full screen mode by tapping the action bar icon.
The app can be downloaded from the Google Play Store.
Get it on Google Play

Monday, October 21, 2013

Rotate JPEG images without loss

Sometimes due to whatever reasons, the cameras mounted on aircraft may not be aligned in the flight direction. For instance, the top of the camera may be facing the tail and not the front of the aircraft, in which case the resultant photographs will be rotated 180 degrees to the flight direction. A simple tool to perform a rotation of the JPEG photographs without the lossy compression is the Jpegtran executable available on http://jpegclub.org/jpegtran/. Using it is easy, as shown below.


  1. In a Windows Command Prompt, type in the following:

    C:> jpegtran -rotate 180 input.jpg output.jpg

    The input.jpg image is rotated by 180 degrees.

Monday, October 14, 2013

SpatiaLite SQL statement to find points in a line buffer


A typical GIS spatial query is to find all the point features in a buffer around a linear feature. This can be easily achieved using SpatiaLite database also. The following illustrates the workflow using two SpatiaLite feature tables - nodes and segments.

Using any SpatiaLite interface (graphical or command line interface), simply type in the following SQL statement to create a 50 meter buffer around the line segment feature using the spatial operator ST_Buffer:

SELECT ST_Buffer(Geometry, 50) AS buffer 
FROM segments
WHERE name='line1'


The screenshot below shows how the 50 meter buffer looks like on a map.

To identify all the point nodes within the buffer, we can wrap the buffer statement in a more complex SQL statement:

SELECT a.* FROM nodes AS a,
(
SELECT buffer FROM
(
SELECT ST_Buffer(Geometry, 50) AS buffer 
FROM segments
WHERE name='line1'
) AS b
)
WHERE ST_Contains(buffer, a.Geometry)

The screenshot shows how the results are like on a map.

Monday, October 7, 2013

Edit line segments to snap to vertex nodes in Quantum GIS

I use QGIS to manage a linear network dataset for shortest path routing analysis. In order to perform the analysis, one of the requirements is to ensure that the line segments end points are snapped properly to the network nodes; if they are not snapped, then the routing would not be able to traverse pass the segment. There are tools in QGIS to help snap line segments to vertices, as illustrated below.

  1. In QGIS, load and display the line segments and point node layers, e.g. segments and stations.

    The layers are displayed.
  2. Select Settings | Snapping Options.

    The Snapping options dialog box appears.
  3. Toggle on the point nodes layer, e.g. stations. In the Tolerance field, type in a value which is reasonable for the dataset, e.g. 20 meters or 200 meters.

  4. Click OK.
  5. In the Layers pane, select the line segments layer. Then click the Select Single Feature icon. Click on the line segment to be snapped.

    The segment is highlighted.
  6. Press down the Toggle Editing icon.

    The vertex handles are displayed on the selected segment.
  7. Click the Node Tool icon. Click on the line segment.

    Red boxes appear around the vertex handles.
  8. Click on the line segment vertex that will be snapped to the node.

    A blue box appears around the vertex.
  9. Drag the blue vertex to the node.

    The line segment is snapped to the node.
  10. Press the Toggle Editing icon to end the editing.

    A prompt appears.
  11. Click Save.

    The changes are saved.

Monday, September 30, 2013

Routing analysis using Quantum GIS and SpatiaLite

After preparing a network graph in a SpatiaLite database for routing analysis in my previous post, you can perform shortest path analysis just by typing in SQL commands in the SpatiaLite-gui. The results are returned as result set rows which are textual - functional but difficult to visualize. It is more fun to do it in a visual environment such as Quantum GIS or QGIS for short as shown below.

  1. Start QGIS.

    The QGIS application appears.

  2. Select Layer | Add SpatiaLite Layer.

    The Add SpatiaLite Table(s) dialog box appears.

  3. Click New. Browse and select a SpatiaLite database e.g. roads.sqlite. Click Open.

    The selected database is added to the Databases drop down list.


  4. If not selected, then choose the database in the Databases drop down list. Click Connect.

    The list of tables is displayed.

  5. Select roads. Click Add.

    The roads layer is displayed in the map.

  6. Select Database | SpatiaLite | QSpatiaLite.

    The QspatiaLite dialog box appears.

  7. In the SQL entry field, type in the following:

    SELECT * FROM roads_network_net
    WHERE nodefrom = 1
    AND nodeto = 1000


    Note: this queries the network graph for the shortest path between the from node #1 and the to node #1000. The node ids from the nodes table.
  8. Click Run SQL.

    The result is displayed.


    Note: only the first record has a geometry. This geometry object contains the geometry of the shortest path. The subsequent rows list out each segment of the shortest path.
  9. In the SQL entry field, type in the following:

    CREATE TABLE route1 AS
    SELECT * FROM roads_network_net
    WHERE nodefrom = 1
    AND nodeto = 1000
    AND geometry IS NOT NULL


    Note: this will create a route1 table that can be displayed in QGIS.
  10. Click Run SQL.

    A table named 'route1' is created.
  11. In the SQL Entry field, type in the following:

    SELECT RecoverGeometryColumn('route1','Geometry',4326,'LINESTRING','XY')

    Note: change 4326 to the appropriate SRID of your data.
  12. Click Run SQL.

    The 'route1' table is registered as a spatial table.
  13. In the list of tables of the QSpatiaLite dialog box, right click on the newly created table 'route1'.

    A pop up menu appears.
  14. Choose Load in QGIS.

    The shortest path result layer is loaded in the map.


Monday, September 23, 2013

Using Spatialite to prepare road segments for routing analysis

SpatiaLite is a extension to the light weight database Sqlite that extends the database with spatial processing capabilities similar to what PostGis gives PostgreSQL. One of the capabilities that I wanted to use recently was the ability to perform shortest path routing analysis using the Dijkstra algorithm. In order to perform the analysis, the roads network data has to be processed into a suitable form for SpatiaLite to use. The following illustrates how to do the processing (assuming the road data is topologically correct). It can be done using the spatialite-gui executable which can be downloaded from http://www.gaia-gis.it/gaia-sins/.

Create a new SpatiaLite database

  1. Run the spatialite-gui.exe.

    The spatialite-gui [a GUI tool for SQLite/SpatiaLite] application appears.

  2. Select Files | Creating a new (empty) SQLite DB.

    The Creating a new, empty DB dialog appears.

  3. Type in a new database name e.g. roads.sqlite. Click Save.

    The database is created.

Load in the road segments data
  1. Select Files | Load Shapefile.

    The Load Shapefile dialog appears.
  2. Select a shapefile e.g. roads.shp. Click Open.

    The Load Shapefile dialog box appears.

  3. If necessary, choose an appropriate Charset Encoding, e.g. UTF-8.
  4. If necessary, type in the correct coordinate system SRID for the Shapefile e.g. 4326. Click OK.

    The Shapefile is loaded.

Preprocess the road segments for network building
  1. In the SQL entry field, type in the following statement.

    CREATE VIEW tmp_roads AS
    SELECT *, STARTPOINT(geometry) AS startp, ENDPOINT(geometry) AS endp
    FROM roads


  2. Then click the button Execute SQL Statement.

    The view is created.
  3. Type in the following SQL statement to create a nodes table containing all the starting and ending nodes.

    CREATE TABLE nodes AS
    SELECT ROWID AS id, a.p AS geometry FROM
    (
    SELECT DISTINCT tmp_roads.startp AS p FROM tmp_roads
    UNION
    SELECT DISTINCT tmp_roads.endp AS p FROM tmp_roads
    ) a
    GROUP BY a.p

  4. Click the Execute SQL Statement button.

    The nodes table is created.
  5. Type in the following SQL statement.

    CREATE TABLE roads_network AS
    SELECT a.*, b.id AS start_id, c.id AS end_id
    FROM tmp_roads AS a
    JOIN nodes AS b ON a.startp = b.geometry
    JOIN nodes AS c ON a.endp = c.geometry

  6. Click the Execute SQL Statement button.

    The roads_network table is created.
Build the Network
  1. Select Files | Build Network.

    The Build Network dialog box appears.

  2. In the Base Table [graph] field, select the table created in the previous step, e.g. roads_network.
  3. In the NodeFrom column field, select the column start_id.
  4. In the NodeTo Column field, select the column end_id.
  5. In the Geometry Column field, select Geometry.
  6. Choose Uni-Directional or Bi-Directional.
  7. Choose the Cost type - GLength or Cost Column. If Cost Column is chosen, then select the Cost Column e.g. Cost.
  8. If necessary, choose Using OneWay columns or Not. If Using is chosen, then select the From To Column and To From Column.

  9. Click OK.

    The network is created.

Monday, September 16, 2013

Trainsity Singapore Android app

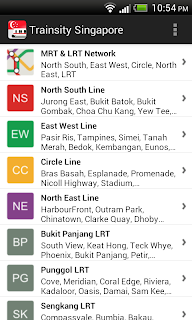
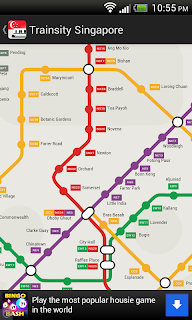
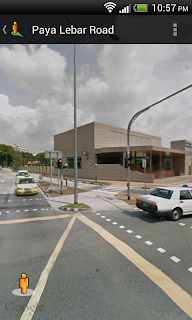
This is an Android app that simply displays the Singapore MRT and LRT train network maps. The maps are high resolution vector files instead of raster images; the file sizes are small and you can zoom closer without having the details becoming blurred or "pixelated", like bitmap images. The maps also have some interactivity coded in - when the train station labels are touched (or clicked), an option menu will pop up. Users can then choose to send the station location to the Google Maps or the Google Street View apps, where they can visualize the surroundings and/or perform directions routing.


The following screenshots show how the app behaves on a mobile handset.


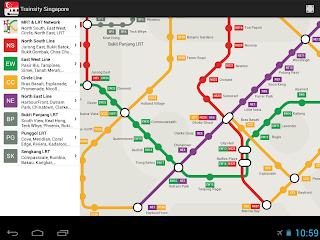
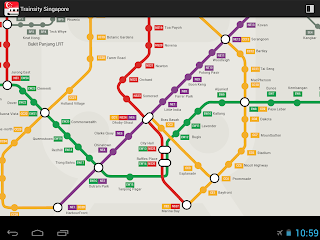
On tablets, the app will automatically configure itself as a two pane display, as shown below. An ActionBar toggle button can be used to toggle the map display from two pane to full screen.


The app can be download from the Google Play Store.
Get it on Google Play