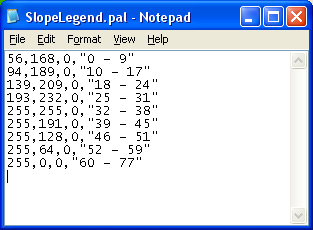
The first three numbers correspond to the RGB color values. The last column is the label enclosed in double quotes.
To use this custom color palette in Global Mapper, do the following:
- Start up Global Mapper. Load a non-elevation grid data, e.g. slope.asc.
- Select Tools | Map Layout.
The Setup Map Layout dialog box appears.
- In the Map Legend group drop down list, choose Display Legend on Color Palette.
The Setup Palette dialog box appears.
Note: you can interactively define the colors and matching labels using the buttons or load in a previously created color palette file. - Click Load Palette File. Browse and select an existing color palette file, e.g. SlopeLegend.pal. Click Open.
The select color palette is loaded and displayed in the Palette list box.
- Click OK.
- In the Map Legend group's Header field, type in a meaningful Header e.g. Slope in Degrees. Click OK.
The custom map legend is displayed in the map window.

No comments:
Post a Comment