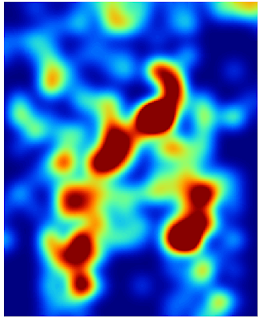
In SAGA GIS, the Reclassify Grid Values module can do the zoning. Once the continuous surface has been classified into groups, meaningful numerical information such as the area of the hot spots can be derived.
The following describes how I use SAGA GIS to reclassify and calculate the zone area values.
Reclassifying into discrete zones
- Start up SAGA GIS. Load in a continuous grid layer e.g. hotspot.sgrd.
- In the Workspace pane on the left, select the grid layer. In the Options pane on the right, click the Description pane.
- Examine the Value Range and note down the values, e.g. 0 - 10. Note: this will be used to determine how to group the data.
- Select Modules | Grid | Tools | Values | Reclassify Grid Values.
The Reclassify Grid Values dialog box appears. - In the Grid system drop down list, choose the grid system e.g. "30;354x420y...".
- In the Grid drop down list, choose the grid layer for reclassification, e.g. "01.hotspot".
- In the Method drop down list, choose simple table.

- Click the Method simple table's Lookup Table row. Click [...].
The Lookup Table dialog box appears. - Use the minimum, maximum, and new columns to define the input ranges to reclassify, e.g. 0~3 to 1, 3~6 to 2 and so on.

- Click Okay twice.
The grid layer is reclassified.
Visualizing the discrete zones
- In the Workspace pane, double click the discrete zone grid layer e.g. "03.Reclassified Grid" and display in a new map window.
Note: the default colors may not be optimal in showing off the zones as shown below.
- On the Options pane on the right, click the Settings tab. Change the Display:Color Classification Type to Lookup Table.

- Click the Lookup Table's Table row. Click [...].
The Table dialog box appears. - Enter the NAME, DESCRIPTION, MINIMUM, MAXIMUM values appropriate for the discrete zones grid layer and define unique colors for each range, as shown below.

- Click Okay.
- Click Apply.
The map window is updated with the new colors which show off the zones better.
Calculating the zone areas
- Select Modules | Geostatistics | Grids | Zonal Grid Statistics.
The Zonal Grid Statistics dialog box appears. - Click the Grid system drop down list and choose the discrete grid layer's system.
- In the Zone Grid drop down list, choose the discrete zone grid layer, e.g. "03.Reclassified Grid".

- Click Okay.
The zonal statistics table is created.
- In the Workspace pane, double click the newly created zonal statistics table e.g. "01.Zonal Statistics" to display it.
Note: the Count column counts the number of grid cells within a zone.
- Select Modules | Table | Calculus | Table Calculator.
The Table calculator dialog box appears. - In the Table drop down list, choose the newly create table, e.g. "01.Zonal Statistics".
- In the Formula field, type in the formula to calculate the zone area, e.g. if the area of a grid cell is 2 square meter, then the zone area formula is b*2, where b refers to the second column.
- In the Field Name, type in the new field name, e.g. area.

- Click Okay.
The new table is generated.
- In the Workspace pane, double click on the newly created table.
The new table is displayed. Note the new area field showing the calculated zone area.

No comments:
Post a Comment