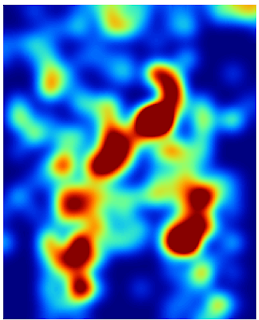
We can further demarcate the hot spots with SAGA GIS's Contour Lines from Grid module.
- Start up SAGA GIS and load in the grid layer of the total incident occurrences.
- Select Modules | Shapes | Grid | Contour Lines from Grid.
The Contour Lines from Grid dialog box appears. - In the Grid system drop down list, choose the grid system of the grid layer, e.g. "30; 354x 420y...".
- Click the Grid row drop down list and choose the grid layer, e.g. "03.ifelse(lt(a,0),0,a)".
- If necessary, change the Minimum Contour Value, Maximum Contour Value and Equidistance values.

- Click Okay.
The contour lines are generated.
Note: in the Workspace pane, double click the contour line shape line layer to display it overlaid on the incident occurrence grid layer, as shown below.
Labeling the contour lines - In the Workspace pane, select the Line shape layer of the contour lines e.g. "01.ifelse(lt(a,0),0,a)".
- In the Options pane on the right, click the Display:Label Attribute drop down list and choose the attribute field to use for labeling, e.g. "ifelse(lt(a,0),0,a)".

- Click Apply.
The contour lines are labeled.

No comments:
Post a Comment