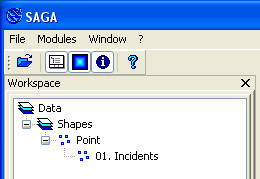
The point vector data may be storing additional attributes about the incident such as the number of occurrences.

Just by looking at the vector point data, it is impossible to detect a pattern or hot spot incidents in the area. By forming a graphical occurrence distribution surface from the vector point data with a grid analysis tool like SAGA GIS, it would be so much easier to visualize the areas of high incident density. An example of this surface is shown below, overlaid with other map features for reference.

Below are the steps I took to generate the grid surface for visualizing the incident patterns.
Import vector point data
- Start up SAGA GIS.
- Select Modules | File | GDAL/OGR | OGR: Import Vector Data.
The OGR: Import Vector Data dialog box appears. - Click the Files row. Click the [...] button on the right. Browse and select the point vector data file e.g. Incidents.shp. Click Open.
The selected file is displayed in the OGR: Import Vector Data dialog box.
- Click Okay.
The point data is imported into SAGA GIS.
Convert the vector point data to a grid layer
- Select Modules | Grid | Gridding | Shapes to Grid.
The Shapes to Grid dialog box appears. - Click the Shapes drop down list and select the previously imported vector points e.g. 01.Incidents.
- Click the Attribute drop down list and select the field to get the new grid cell values, e.g. OCCURRENCE.
- Click the Preferred Target Grid Type drop down list and select a suitable data type e.g. Integer (2 byte).

- Click Okay.
The User Defined Grid dialog box appears. - In the Cellsize field, type in the new cell size e.g. 30.

- Click Okay.
The vector points are rasterized into a new grid layer.
Workaround the Aggregate module's Sum No Data cell value bug
SAGA GIS 2.0.5's Aggregate module has a problem summing grid cells with negative values, i.e. cells with no data and usually represented with a large negative number e.g. -99999. In order for the SUM function to work, those large negative values have to be set to 0. This can be done by using the Calculus module as described below.
- In the Workspace pane, select the newly created point grid layer e.g. 01.Incidents [OCCURRENCE].

- In the Object Properties pane on the right, click the Settings tab. Then change the No Data field values to "0; 0".

- Click Apply.
- Select Modules | Grid | Calculus | Grid Calculator.
The Grid Calculator dialog box appears. - In the Grid system drop down list, select the newly created grid layer's system, e.g. "30;354x 420y;...".
- Select the Grids row. Click the [...] button
The Grids dialog box appears.
- On the list on the left side, select the newly created grid layer, e.g. 01.Incidents[OCCURRENCE]. Click the >> button.
The selected grid layer is moved to the list on the right. - Click Okay.
The Grids dialog box is closed. - In the Formula field, type in ifelse(lt(a,0),0,a).
Note: this formula tells the Calculator to replace all grid cell values below 0 with the value 0.
- Click Okay.
A new grid layer is created with no negative values.
Using Aggregate to sum adjacent grid cells
- Select Modules | Grid | Construction | Aggregate.
The Aggregate dialog box appears. - In the Grid system drop down list, choose the previously created grid layer's system, e.g. "30;354x 420y;...".
- In the Grid drop down list, select the newly created grid layer without negative values, e.g. ifelse(lt(a,0),0,a).
- In the Aggregation Size field, type in an appropriate size (in cells), e.g. 20. In the Method drop down list, choose Sum.

- Click Okay.
The aggregated grid layer is created.
This is how the aggregated layer looks like in the map view.
Resample the aggregated grid layer to match the original point grid layer.
- Select Modules | Grid | Construction | Resampling.
The Resampling dialog box appears. - In the Grid system drop down list, select the aggregated grid layer's system, e.g. "600;17x21y...".
- In the Grid drop down list, choose the aggregated grid layer, e.g. "ifelse(lt(a,0),0,a)".
- In the Target Grid drop down list, choose grid.

- Click Okay.
The Choose Grid dialog box appears. - In the Grid system drop down list, choose the original point grid layer's system, e.g. "30;354x420y...".

- Click Okay.
The Down-Scaling dialog box appears.
- Click Okay.
The aggregated grid layer is resampled to match the original point grid layer's dimensions.

No comments:
Post a Comment