Monday, May 13, 2019

Setting up Visual Studio Code for working with ROS C++ on Ubuntu

In order to use Visual Studio Code on Ubuntu to develop ROS (Robotic Operating System) C++ packages, a couple of Visual Studio Code extensions can be helpful.

If they are not already installed, simply run Visual Studio Code and install the following extensions:
  • Microsoft C/C++ extension
  • ROS extension

Another thing that can be helpful is to configure the Microsoft C/C++ extension to include the ROS header include files. If the extension is unable to locate the ROS header files, the code editor will show wavy green lines under the header files, as shown in the screenshot below.

To get rid of these wavy lines, the C/C++ properties (c_cpp_properties.json) file need to be edited to add in the ROS header include directory, e.g. /opt/ros/melodic/include/.

The following screenshots show the c_cpp_properties.json file and the includePath configuration array.

Append the path "/opt/ros/melodic/include" to the includePath array variable as shown below.

Then save and restart Visual Studio Code. Observe that the green wavy lines are no longer displayed.

Monday, May 6, 2019

Export Velodyne PCAP to LAS files in VeloView

VeloView is an open source application for working with Velodyne's popular LiDAR sensors (HDL-64E, HDL-32E, VLP-16 etc.). It is available from this website https://www.paraview.org/veloview/.

VeloView has an export to LAS file format command but you would not know it as it is not available from the graphical user interface. To generate LAS files, it is necessary to use the Python command line interface. The steps below show how it can be done.
  1. Run VeloView and load a Velodyne PCAP file.

  2. Choose Tools | Python Console.

    The Python Console appears.
  3. To export out the current frame, type in the following command at the Python prompt.

    >>> vv.saveLASCurrentFrame('c:/path/to/output.las', 0)

    Note 1: the last argument indicates the coordinate transformation mode. 0 = raw, 1 = absolute, 2 = relative.
    Note 2: Replace c:/path/to/ with your actual file system path
  4. To export a range of frames by frame numbers, type in the following command at the Python prompt.

    >>> vv.saveLASFrames('c:/path/to/output.las', 10, 20, 0)

    Note: in this example, 10 is the starting frame, 20 is the ending frame, and 0 is the raw transformation mode.
  5. To export a list of frames by time steps, type in the following command at the Python prompt.

    >>> vv.saveLAS('c:/path/to/output/las', timesteps, 0)

    Note: timesteps is an array of integers specifying the time steps e.g. [0,1,2,...10] and 0 is the raw transformation mode.

    To get the available time steps in the PCAP file, type in the following command at the Python prompt.

    >>> timesteps = vv.getCurrentTimesteps()
  6. Optional. Display the resultant LAS file in a viewer.

Monday, April 29, 2019

Create a Facebook 3D Photo of a digital elevation model using QGIS

Facebook has a 3D photo feature which brings perspective and movement to the Facebook news feed and timeline images. A live example can be seen embedded here:


Normally these images are created using RGB-D cameras, where D stands for depth. However it is also possible to workaround it without a RGB-D camera by uploading to Facebook two images - an RGB image and its corresponding grayscale depth image, and making sure the depth image has the same name as the RGB image with a '_depth' suffix. The depth image is grayscale only with values ranging from dark to light -  the dark pixels representing the furthest pixels and the light pixels representing the nearest pixels.

Using the ideas above, the following steps illustrate how to create a Facebook 3D Photo image from a SRTM digital elevation model (DEM) using QGIS.

  1. Startup QGIS. Create a new project. If the canvas background is not already black, select Project | Project Properties.

    The Project Properties dialog box appears.
  2. In the Background color field, change the color to black. Click OK.

    The canvas background becomes black.
  3. Drag and drop a DEM file onto the canvas e.g. srtm_54_07.tif.

     
  4.  Optional. To serve the purpose of having a background, an OpenStreetMap (OSM) layer is displayed behind the DEM layer.

  5. Optional. To display only DEM heights above an elevation of interest, e.g. 200 meters, right click on the DEM layer and choose Properties. Then add in a new transparent entry to the transparent pixel list from 0 to 200 meters, as shown below. Then click OK.

    The Layer Properties dialog box appears.


    The DEM display is updated.

  6. Make a duplicate of the DEM layer by right clicking on the DEM layer and choosing Duplicate. Rename the copy as 'depth' as it will serve to generate a depth image later on.

  7. Right click on the top most DEM layer and choose Properties. In the Layer properties dialog box, click Style.

  8. Change the Render Type to Hillshade. Click OK.

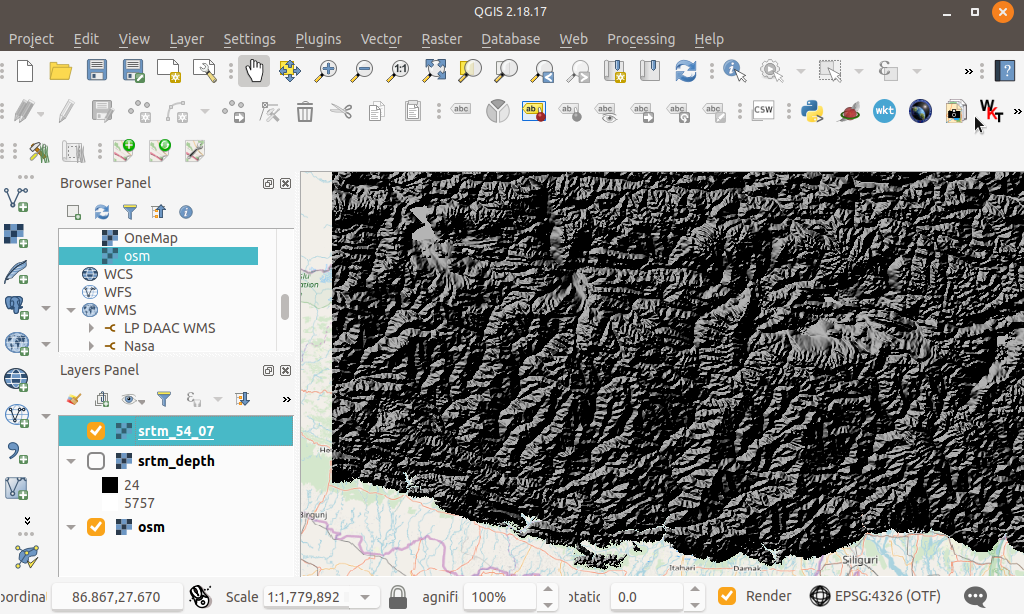
    The DEM layer is now rendered as a hill shade.
  9. Make a duplicate copy of the hill shaded DEM layer by right clicking the layer and choosing Duplicate. Rename the copy as 'hillshade' as shown below.

  10. Right click on the top most DEM layer and choose Properties. Select the Style tab.

  11. In the Rendering type field, choose Singleband pseudocolor. Choose a suitable color gradient e.g. Spectral and toggle Invert if necessary. Choose a suitable Blending mode e.g. Screen.

  12. Click OK.

    The DEM layer is rendered with a colored gradient.
  13. With the gradient colored, hill shaded and OSM layers displayed on and the depth layer displayed off, export out the canvas by selecting Project | Save as image and specifying an output file name e.g. srtm.png.

    The srtm image is generated.
  14. Now turn off the gradient, hill shaded and OSM layers. Turn on the depth layer as shown below.


    Select Project | Save as image to export out the depth image with a '_depth' suffix e.g. srtm_depth.png.

    The srtm_depth image is generated.
  15. Now open up Facebook in a browser and click the Post Photo/Video button.

    The File Upload dialog box appears.
  16. Browse and select the generated srtm.png and srtm_depth.png files. Click Open.

    Facebook generates the 3D Photo.


    A live example is available here at https://www.facebook.com/permalink.php?story_fbid=1251984134967474&id=101193703379862

Monday, April 22, 2019

Migrating Android support library Renderscript code to AndroidX

Android is deprecating the Support compatibility libraries  and replacing them with the new AndroidX libraries. To aid in the migration of Android projects using the deprecated support libraries, Android Studio has a Refactor to AndroidX tool. I used that to migrate an old Android project and while it works for the most part, it did not manage to migrate the files using the support renderscript classes; I presume that is because the AndroidX namespace does not have the equivalent renderscript classes.

To complete the migration to AndroidX, I had to do the following by hand:

  1. In all the code files using the android.support.v8.renderscript.* classes, replace them to android.renderscript.* as shown below.

  2. In the app's build.gradle file, upgrade the renderscriptTargetApi level to 17 and turn off the renderscript support mode (renderscriptSupportModeEnabled to false) as shown below.


  3. Save all the files and rebuild the project.

    The project should manage to sync and build successfully.
Note: At the time of writing, Android can only compile android.renderscript.* classes into 32 bit *.bc files. This may be a problem in future as Google Play is moving to apks that support 64 bit files. 

Monday, April 15, 2019

Speed up Android Studio startup by disabling unnecessary plugins

Android Studio loads a relatively large number of plugins on start up. Depending on your workflow, some of them may not be needed. For instance, if you don't use Subversion as your source code repository, then the Subversion plugin may not need to be loaded especially if your machine is slow or RAM is limited.

To disable plugins, do the following:

  1. Start Android Studio.


  2. In the Configure drop down menu at the bottom right, choose Plugins.

    The Plugins dialog box appears.

  3. Scroll down the list and toggle off the unneeded plugins e.g. CVS Integration. Click OK.

    The Prompt appears.

  4. Click Restart.

    Android Studio is restarted without the disabled plugins.

Monday, April 8, 2019

Segment individual trees from TLS point clouds with 3DForest

Identifying individual trees from point clouds scanned using Terrestrial LiDAR System (TLS can be easily segmented using this freely downloable software 3DForest. For more information about 3DForest, visit http://www.3dforest.eu/.

Note: although 3DForest has its own ground classification filter, I found it better to perform the ground / non-ground classification using alternative software like PDAL.

To use 3DForest to segment individual trees, the following steps can be done:
  1. Start up 3DForest. Select Project | New Project to create a new project.

    The 3DForest application appears.
  2. In the menu, choose Project | Import | Import Terrain Cloud to load in a LAS file of only ground points.

  3. In the dialog box that pops up, choose a ground class only LAS file, e.g. sample_ground.las.

    The LAS file is converted into a PCD format file and displayed.
  4. Next, choose Project | Import Vegetation Cloud. Choose a non-ground class only LAS file, e.g. sample_vegetation.las.

    The non-ground class LAS file is converted into PCD format and displayed.
  5. In the menu, select Vegetation | Automatic Segmentation to run the individual tree segmentation algorithm.

    The Automatic Segmentation dialog box appears.

  6. In the Input Vegetation Cloud combo box, choose the newly loaded sample_vegetation LAS file.
  7. In the Input Terrain Cloud combo box, choose the loaded sample_ground LAS file.
  8. If necessary, change the parameters, e.g. Prefix of Clouds value from ID to TreeID. Click OK.

    The individual trees are segmented into individual point clouds.


  9. If required, select Project | Export | Export Clouds to export the segmented trees to text or PLY formatted files.

Monday, December 3, 2018

Use PDAL to export colored LAS file to Point Cloud XYZ format text file

PDAL can be used to export out a colored laser LAS file like the one in the screenshot below into a text file in Point Cloud XYZ format, which is just an ASCII text file with each point in a row of X, Y, Z, R, G, B values.

To use PDAL to perform the conversion, follow the following steps.
  1. In Windows, open up an OSGeo4W Shell.


  2. In the command prompt, change directory to the folder containing the LAS file e.g. D:\Temp\data\.

  3. Use a text editor to create a PDAL pipeline JSON file, e.g. las2xyz.json, with the following contents.

    {
      "pipeline":[
        {
          "type":"readers.las",
          "filename":"color.las"
        },
        {
          "type":"writers.text",
          "format":"csv",
          "order":"X,Y,Z,RED:0,GREEN:0,BLUE:0",
          "keep_unspecified":"false",
       "quote_header": "false",
       "delimiter": " ",
          "filename":"outputfile.xyz"
        }
      ]
    }
    

    where color.las is the name of the input LAS file
    and outputfile.xyz is obviously the name of the output XYZ file.
  4. In the command prompt, type in the following command to perform the conversion.

    D:\> pdal pipeline las2xyz.json
  5. Press Enter.

    The X, Y, Z, R, G, B values of the LAS file are exported out into the text Point Cloud XYZ file.