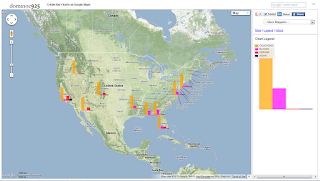
Creating the bar charts is simple as shown below:
- Run the Mapplet by opening this link http://dominoc925-pages.appspot.com/mapplets/map_barcharts.html from any modern browser.
- Click Import CSV.
The Import Comma Separated Values (CSV) File dialog appears.
Note: The CSV data must have a header row, geographic latitude and longitude columns to point to the locations to place the charts on. - Click Choose File. Browse and select a CSV file. Alternatively, copy and paste the contents of a CSV file into the text box.
The CSV data is loaded into the text box. The color scheme combo boxes for each CSV data column appear.
- If necessary, choose the correct CSV Delimiter, Latitude Column, and Longitude Column from the combo boxes.
- From the Chart Orientation field, choose either Vertical or Horizontal.
- Optional. Choose the chart size in pixels.
- In the Color scheme combo boxes, choose the colors to represent the CSV data columns.
- Click Create Charts.
The horizontal bar charts are created.
- The charts created can be clicked on to show the values. The charts can also be dragged and moved to a different location on the map if necessary.


