Showing posts with label Google Mapplets. Show all posts

Monday, January 29, 2018

Display CSV (with WKT geometry field) files on Google Maps with this Mapplet

If you want to display a Comma Separated Values (CSV) file with an embedded geometry field in Well Known Text (WKT) format with just an Internet browser, then this Mapplet may be useful to you. Just go to this url https://dominoc925-pages.appspot.com/mapplets/vcsvfile.html with any modern browser such as Chrome, or FireFox. All the processing is done within your browser, that is the CSV file is never uploaded to a server for processing.


  1. To load a CSV file, click on the Import CSV button (in blue color) as shown in the screenshot below. 


    The Import Comma Separated Values (CSV) file dialog box appears.

  2. To load in a CSV file from a local drive, click the Choose File button. Then browse and select a CSV file as shown below.


    Note: You can also copy and paste WKT text into the CSV file field's text area. Or click the Use Sample Data drop up button to load demo WKT data into the text area.

  3. Click Open.

    The file is read and displayed in the text area below the Choose File button. The WKT Geometry column button is populated with the header fields from the CSV file.


    Note: If necessary, choose an appropriate Coordinate System and projection.
  4. Click Start Import.

    The CSV file is loaded and rendered as overlays on the Google Maps backdrop. The name of the file is added to a CSV files combo box.

  5. Optional. Click on the CSV Command drop up button and choose a command to apply to the current CSV layer.


    Fit - Display the current CSV layer within the map
    Fit All - Display all loaded CSV layers within the map
    Toggle display - Toggle the CSV layer display on or off
    Display off - Don't display the current CSV layer
    Display on - Display the current CSV layer
    Remove layer - Unload the current CSV layer

Monday, February 13, 2017

Show Myanmar Datum 2000 coordinates with this Mapplet

Myanmar uses a Universe Transverse Mercator projection at Zone 46 (with a Myanmar Datum 2000). For convenience, this mapplet has been written to display and locate Myanmar easting, northing coordinates on Google Maps. To show the coordinates of a location on the map, just click a point on the map, as shown in the screenshot below. A marker Info window will pop up displaying the Myanmar Datum 2000 easting and northing coordinates, as well as the Geographic latitude, and longitude values.

Try out this mapplet at this location https://dominoc925-pages.appspot.com/mapplets/cs_myanmar2000.html

Monday, July 11, 2016

Google Mapplet for displaying Earth Centered, Earth Fixed (ECEF) coordinates

The ECEF (Earth-Centered, Earth-Fixed) coordinate system is commonly used when working with satellites, GPS, space mechanics. For more information, see the Wikipedia site at https://en.wikipedia.org/wiki/ECEF. Sometimes, it may be necessary to convert between ECEF coordinates to geodetic latitude, longitude and altitude coordinates.

This Google Mapplet Show ECEF Coordinates is an easy to use tool for displaying ECEF coordinates on a Google Maps background. To show the coordinates of a location on the map, just click a point on the map, as shown in the screenshot below.

Alternatively, given an ECEF coordinate, simply type in the ECEF's XYZ coordinates in the right pane and click the Locate button. The point will be centered and marked in the map display, as shown below.

Try on this tool at this location https://dominoc925-pages.appspot.com/mapplets/cs_ecef.html


Monday, January 20, 2014

Measure geodesic area on Google Maps

This Google Mapplet can be used to measure polygonal area and perimeter on a sphere in Google Maps using an open source library GeographicLib. Using the mapplet is easy - simply place click three or more points on the Google Maps backdrop to define a polygon; the area and perimeter values will be displayed in the centroid of the polygon.


The default units of measurement for area and perimeter, as well as the polygon boundary color can be changed by selecting the desired values in the right pane.

Once the measurement polygon has been placed on the map backdrop, the vertices can be adjusted either by manually dragging a vertex marker with the mouse or by clicking the vertex marker and entering refined latitude and longitude values.

A vertex marker can be deleted by clicking on the vertex marker and selecting the Delete option.

The mapplet can be found at this link http://dominoc925-pages.appspot.com/mapplets/geoarea.html.


Monday, December 30, 2013

Measure geodesic distances on Google Maps

As the name suggests, this Measure Geodesic Distance mapplet allows users to measure the geodesic distance between two or more points on the earth's surface using the Haversine formula. The mapplet uses the formulas from this site http://www.movable-type.co.uk/scripts/latlong.html. The measurement points and lines are displayed on a Google Maps backdrop. Users have the option to choose the measurement units of meters, kilometers or miles: the line color can also be set by the user.

Run the mapplet from this site http://dominoc925-pages.appspot.com/mapplets/geodistance.html

Using the mapplet is easy, just do the following:

  1. Click two or more points on the map.

    Vertex markers are displayed, and geodetic lines are displayed between the vertex markers.
    Note I : the segment distance value is displayed at the mid point of the line(s).
    Note II: the total distance value is displayed at the last vertex marker. 

  2. Drag a vertex marker to another location on the map.

    The geodetic lines and vertex markers are updated to show the new distances.

  3. Click on a vertex marker.

    The latitude and longitude values are displayed in an Info Window.
  4. In the Info Window, click Delete to delete the vertex marker.

    The vertex marker is removed and the lines and markers are updated to show the new distances.
  5. To adjust a vertex marker by precision key-in, click on a vertex marker.

    The latitude and longitude values are displayed in an Info Window.
  6. In the Info Window, type in the new latitude and/or longitude values. Click Save.

    The vertex marker is moved to the new location and the lines and markers are updated to show the new distances.
  7. To clear all the markers and lines from the map, click the Clear button in the right pane


Monday, June 24, 2013

Create bar charts on Google Maps

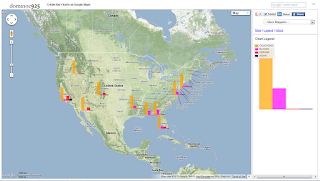
This Mapplet was developed to create bar charts (vertical or horizontal) on Google Maps from text files formatted as comma separated values (CSV). An example screenshot of vertical bar charts is shown below. 


Creating the bar charts is simple as shown below:

  1. Run the Mapplet by opening this link http://dominoc925-pages.appspot.com/mapplets/map_barcharts.html from any modern browser.
  2. Click Import CSV.

    The Import Comma Separated Values (CSV) File dialog appears.

    NoteThe CSV data must have a header row, geographic latitude and longitude columns to point to the locations to place the charts on.
  3. Click Choose File. Browse and select a CSV file. Alternatively, copy and paste the contents of a CSV file into the text box.

    The CSV data is loaded into the text box. The color scheme combo boxes for each CSV data column appear.

  4. If necessary, choose the correct CSV Delimiter, Latitude Column, and Longitude Column from the combo boxes.
  5. From the Chart Orientation field, choose either Vertical or Horizontal.
  6. Optional. Choose the chart size in pixels.
  7. In the Color scheme combo boxes, choose the colors to represent the CSV data columns.
  8. Click Create Charts.

    The horizontal bar charts are created.

  9.  The charts created can be clicked on to show the values. The charts can also be dragged and moved to a different location on the map if necessary.

Monday, December 31, 2012

Display Shapefiles on Google Maps with this Google Mapplet

It would be nice to import and overlay ESRI Shapefiles over a Google Maps backdrop without having to upload the files to a web server. With the new HTML5 FileReader objects  implemented in modern browsers, it is now possible to do this. I burnt some midnight oil to write this tool to read, reproject to the Mercator coordinate system, and display Shapefiles as Google Maps overlays.

The following steps demonstrate how to use the tool.

  1. Use a modern browser (such as Chrome or FireFox) to open this page http://dominoc925-pages.appspot.com/mapplets/vshpfile.html.


  2. Click Import shapefile.

    The Import Shapefile dialog box appears.
  3. In the SHP field, click the Choose File button. Browse and select a Shapefile e.g. mgrs6x8_east.shp.


  4. In the DBF field, click the Choose File button. Browse and select the Shapefile's corresponding DBF file e.g. mgrs6x8_east.dbf.


  5. In the Coordinate system type field, choose the correct system for the Shapefile e.g. Geographic. If Projected is chosen, then choose the correct Projection.


  6. In the Geodetic Datum field, choose the correct datum e.g. WGS84.
  7. Click Start Import.

    If all goes well, the Shapefile will be displayed on the Google Maps backdrop. It might be necessary to zoom into the Shapefile's bounds by clicking the More commands | Fit shapefile buttons on the sidebar.


  8. Click on the Shapefile overlay to display the DBF attributes in an Info window.


  9. Repeat to display more Shapefiles. 

Monday, August 6, 2012

Google Mapplet to show geo-referenced image overlays

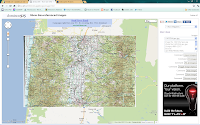
In standard desktop GIS software applications, it is a common task to display geo-referenced images. I wanted to be able to do the same using just a modern browser and an Internet connection. So after a few late nights, I completed writing this Google Mapplet to load and display local image files with associated ESRI world files as custom overlays in Google Maps. I had to use the HTML5 FileReader objects so only modern browsers such as Chrome, FireFox, Internet Explorer 10 will work.

  1. To run the mapplet, simply go to the site http://dominoc925-pages.appspot.com/mapplets/geoimage.html.

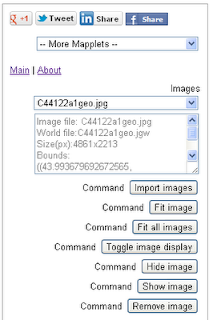
  2. In the sidebar, click the Import Images button.

    The Import image dialog box appears.

  3. In the Image file field, click the button. Browse and select an image file e.g. C44122a1geo.jpg.
  4. In the World file field, click the button. Browse and select the corresponding ESRI world file e.g. C44122a1geo.jgw.
  5. If the image file is in the non-projected coordinate system, then choose Geographic in the Coordinate system type combo box. If the image file is in a projected coordinated system, then choose Projected.

    Note: the raster image transformation for projected coordinate system to the Google Maps Mercator coordinate system is not very accurate. The positioning would be more accurate if the raster image were already in non-projected or Mercator coordinate system.
  6. If the image file is in a projected coordinate system, then choose the correct projection in the Projection combo box.
  7. In the Geodetic Datum field, choose the horizontal datum of the image file, e.g. WGS84, Global Definition.


  8. Click Start Import.

    The image is loaded and displayed.

    If necessary, click the Fit image or Fit all images buttons in the sidebar to center the map display on the image(s)
    .

  9. Optional. If you want to load more images, then repeat the previous steps 3 to 8.
  10. Click Close.

Monday, July 9, 2012

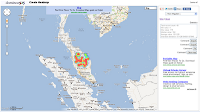
Create geo-referenced heat maps Google Mapplet

Comma-separated-values (CSV) of statistical data in the format latitude, longitude, and magnitude can be imported and visualized as heat maps in Google Maps using this custom mapplet. An example screenshot is shown below.


While the heat maps feature is already possible using the Google Docs FusionTable object, the heat maps created from this Mapplet is done using the HTML5 canvas object via the Javascript heatmap.js library. On  top of that, the Mapplet provides the option to export out the heat map image file along with supporting geo-referenced information in the form of world and projection files.

To run the Mapplet, click this link http://dominoc925-pages.appspot.com/mapplets/vheatmap.html.

The Mapplet's sidebar contains a few button commands that should be obvious - Import, Export, Fit and Clear.


Clicking the Import button brings up the Import Points dialog. 

Copy and paste your comma-separated-values data into the text box. The data must be comma delimited and in  the following order: latitude, longitude, and magnitude. Alternatively, click Use random samples to let the Mapplet randomly create CSV data for demonstration purposes. 

Then click Start Import to create the heat map. 

Click  the Export button to export the heat map and supporting files. This will bring up the Export Heatmap dialog box. 

To save out the heat map image, right click on the image preview and choose Save image as

Next, click on the World file text box and press +C to copy the contents to the clipboard. Then paste inside a text editor and save the world file with the same file name but with the prefix *.pgw. 

Similarly, click on the Projection text box and press +C. Then paste in a text editor and save the contents into a projection file with the same file name prefix but with the extension *.prj. 


Once the image, world file and projection have been exported, the heat map can be displayed and overlaid with other geo-spatial data in any GIS software e.g. Global Mapper as shown below. 


Monday, June 25, 2012

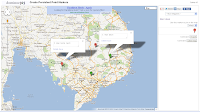
Google Mapplet for creating persistent point markers

This Google Mapplet can be used to create persistent markers on Google Maps that will still be there when you close and reopen the web page. The markers will remain until they are explicitly deleted. The mapplet makes use of the IndexDB feature of the HTML5 specifications to persist the markers in the browser. This means that only modern Internet browsers such as Chrome, Firefox, and the upcoming Internet Explorer 10 will be able persist the markers. The mapplet can function in older browsers such as Internet Explorer 8 or 9 but the markers will not be retained on the next visit to the page.

To run this mapplet, click on the link http://dominoc925-pages.appspot.com/mapplets/plpoint.html.

Choice of markers
You can choose the type of marker to be pinned on to the map e.g. green, orange etc. Once placed, the markers can be dragged to another location, deleted, and labelled.

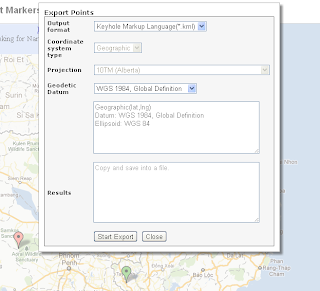
Export Points
The markers can be exported out as KML or comma-separated-values (CSV) format. This can be done by clicking the Export button in the side bar.

The Export Points dialog box is shown below.


Export Points example

  1. In the Output format drop down  box, choose the output format, e.g. KML.

    The Coordinate system type drop down box is enabled for CSV and disabled for KML.
  2. If necessary, in the Coordinate system type field, make a choice e.g. Projected.

    The Projection drop down box is enabled.
  3. If necessary, in the Projection field, choose a suitable destination projection for the output e.g. UTM 48N.
  4. If necessary, in the Geodetic datum field, choose a suitable destination datum e.g. WGS84.
  5. Click Start Export.

    The markers are exported to the destination format. The results are displayed in the Results box.


  6. Click the Results text. Press CTRL+C.
  7. In Notepad, press CTRL+V.

    The results are pasted into Notepad.


  8. Close and save the results into a *.csv file.


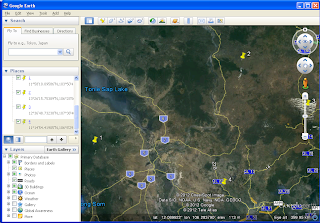
 An example of the results of a KML output displayed in Google Earth is shown below.