Showing posts with label HTML. Show all posts

Monday, October 14, 2019

Simple example of a ReactJS and OpenLayers map component

OpenLayers (https://openlayers.org/) is a "high-performance, feature-packed (Javascript) library for all your mapping needs" for web sites. I spent some time figuring out how to use it with ReactJS. As most of the available examples in the official documentation are for plain vanilla HTML/Javascript, I stumbled a few times trying to get it to work. This post summarises the steps to get a minimal OpenLayers - React component to work. 


Installing OpenLayers for ReactJS
Assuming a ReactJS project has been created e.g. /path/to/React/project/, the first thing is to install the prerequisite software.
  1. Install OpenLayers package for node. Open a Terminal, change directory to the project root directory and type in the following command.

    $ npm install ol --save
  2. Optional. Install Proj4Js and Material-UI.

    $ npm install proj4 @material-ui/core --save
Create the React component for OpenLayers map
Under the ReactJS project e.g. /path/to/React/project/src/components/, create the OpenLayers React component e.g. OLMapFragment.js.

Code listing of OLMapFragment.js
import React from 'react'
import Grid from '@material-ui/core/Grid'

// Start Openlayers imports
import { 
    Map,
    View
 } from 'ol'
import {
    GeoJSON,
    XYZ
} from 'ol/format'
import {
    Tile as TileLayer,
    Vector as VectorLayer
} from 'ol/layer'
import {
    Vector as VectorSource,
    OSM as OSMSource,
    XYZ as XYZSource,
    TileWMS as TileWMSSource
} from 'ol/source'
import {
    Select as SelectInteraction,
    defaults as DefaultInteractions
} from 'ol/interaction'
import { 
    Attribution,
    ScaleLine,
    ZoomSlider,
    Zoom,
    Rotate,
    MousePosition,
    OverviewMap,
    defaults as DefaultControls
} from 'ol/control'
import {
    Style,
    Fill as FillStyle,
    RegularShape as RegularShapeStyle,
    Stroke as StrokeStyle
} from 'ol/style'

import { 
    Projection,
    get as getProjection
 } from 'ol/proj'

// End Openlayers imports

class OLMapFragment extends React.Component {
    constructor(props) {
        super(props)
        this.updateDimensions = this.updateDimensions.bind(this)
    }
    updateDimensions(){
        const h = window.innerWidth >= 992 ? window.innerHeight : 400
        this.setState({height: h})
    }
    componentWillMount(){
        window.addEventListener('resize', this.updateDimensions)
        this.updateDimensions()
    }
    componentDidMount(){

        // Create an Openlayer Map instance with two tile layers
        const map = new Map({
            //  Display the map in the div with the id of map
            target: 'map',
            layers: [
                new TileLayer({
                    source: new XYZSource({
                        url: 'https://{a-c}.tile.openstreetmap.org/{z}/{x}/{y}.png',
                        projection: 'EPSG:3857'
                    })
                }),
                new TileLayer({
                    source: new TileWMSSource({
                        url: 'https://ahocevar.com/geoserver/wms',
                        params: {
                            layers: 'topp:states',
                            'TILED': true,
                        },
                        projection: 'EPSG:4326'
                    }),
                    name: 'USA'
                }),
            ],
            // Add in the following map controls
            controls: DefaultControls().extend([
                new ZoomSlider(),
                new MousePosition(),
                new ScaleLine(),
                new OverviewMap()
            ]),
            // Render the tile layers in a map view with a Mercator projection
            view: new View({
                projection: 'EPSG:3857',
                center: [0, 0],
                zoom: 2
            })
        })
    }
    componentWillUnmount(){
        window.removeEventListener('resize', this.updateDimensions)
    }
    render(){
        const style = {
            width: '100%',
            height:this.state.height,
            backgroundColor: '#cccccc',
        }
        return (
            <Grid container>
                <Grid item xs={12}>
                    <div id='map' style={style} >
                    </div>
                </Grid>
            </Grid>
        )
    }
}
export default OLMapFragment

Use the React OpenLayers map component
Now in the ReactJS project's index.js file under /path/to/React/project/src/, import in the newly created OLMapFragment component and render it.

Listing of index.js
import React from 'react'
import { render} from 'react-dom'
import OLMapFragment from './js/components/OLMapFragment'

render(
    <OLMapFragment />
    ,
    document.getElementById('react-container')
)

Create the default index.html file
Finally, include links to OpenLayer's style sheets in the project's index.html file under /path/to/React/project/src/.
Listing of index.html file
<!DOCTYPE html>
<html class="no-js" lang="en">

<head>
    <meta charset="utf-8">
    <meta http-equiv="x-ua-compatible" content='ie=edge'>
    <title>Openlayers React</title>
    <meta name="description" content="Explore planet Mars">
    <meta name="viewport" content="minimum-scale=1, initial-scale=1, width=device-width, shrink-to-fit=no" />
    <!-- material-ui prerequisites -->
    <link rel="stylesheet" href="https://fonts.googleapis.com/css?family=Roboto:300,400,500,700&display=swap" />
    <link rel="stylesheet" href="https://fonts.googleapis.com/icon?family=Material+Icons" />
    <!-- end material-ui prerequisites -->

    <link rel="stylesheet" href="https://cdn.rawgit.com/openlayers/openlayers.github.io/master/en/v5.3.0/css/ol.css"
        type="text/css" />

</head>

<body>
    <!--[if lte IE 8]
        <p class="chromeframe">You are using an <strong>outdated</strong> browser. Please <a href="http://browsehappy.com">upgrade your browser</a></p>
        <![endif]-->
    <div id='react-container'></div>

</body>

</html>

Now, run the ReactJS project with a web server and open the web page with an Internet browser.

The web map tiles are rendered in the React OpenLayers component.

Monday, February 20, 2017

Clear Javascript, CSS, and HTML web cache in Chrome

When developing Javascript code for web pages, the Chrome browser caches the Javascript code including cascading style sheets and HTML files. Any changes made to the code may not be reflected when the page is refreshed. I found this frustrating. That is, until I discovered that Chrome has a way to clear its cache before reloading the web page.

To enable this, do the following:

  1. Select Options (the 3 vertical dots icon on the top right) | More Tools | Developer Tools.

    The Developer Tools pane appears.
  2. Now, do a mouse-right click on the Reload Page icon, as shown in the screenshot below.

    A popup menu appears.

  3. Choose Empty Cache and Hard Reload.

    The cache is cleared and any any changes made to the code is reflected in the reloaded page.


Monday, March 7, 2016

Highlight the active link on a single HTML page using jQuery and Bootstrap

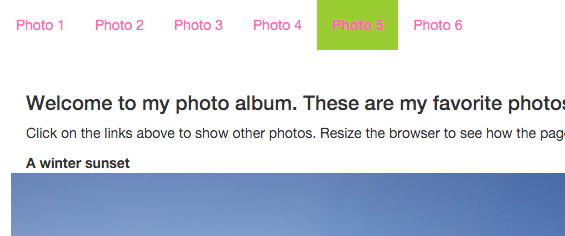
In a web page, it is useful to indicate the active page (or photo or whatever) in the navigation links by changing some style to differentiate it from the other links. An example is the Photo 4 link in the screenshot below.

When the user clicks on another item, the other link e.g. Photo 5 is highlighted and the previously active link becomes a normal link again, as shown below.

I wanted to do the same but on a single page without resorting to server side programming. This can be done with some help using jQuery, Bootstrap, HTML and some custom CSS styles. Bootstrap can be downloaded from http://getbootstrap.com/. jQuery can be downloaded from https://jquery.com/

1. In the HTML page, set up the links with the nav semantic tag with the Bootstrap classes navbar, navbar-nav as shown below. A unique id e.g. main-nav should be assigned also.


<!doctype html>
<html lang="en">
<head>
<title>My favorite photos</title>
<link href="css/bootstrap.css" rel="stylesheet"/>
<link href="css/styles.css" rel="stylesheet"/>
<script src="js/jquery.min.js" ></script>
<script src="js/bootstrap.min.js" ></script>
</head>
    
<body>
<nav class="navbar">
    <div>
        <ul id="main-nav" class="nav navbar-nav">
            <li><a href="#" class="active photo-link" >Photo 1</a></li>
            <li><a href="#" class="photo-link" >Photo 2</a></li>
            <li><a href="#" class="photo-link" >Photo 3</a></li>
            <li><a href="#" class="photo-link" >Photo 4</a></li>
            <li><a href="#" class="photo-link" >Photo 5</a></li>
            <li><a href="#" class="photo-link" >Photo 6</a></li>
        </ul>
    </div>
</nav>
<!-- etc -->

2. Next define custom CSS styles for the non-active and active links. In this example, the non-active link is the photo-link class style.

.photo-link{
    color: hotpink;
}
.active {
    background-color: yellowgreen;
    font-weight: bold;
}
3. To tie the HTML and the styles, create a Javascript function as shown in the code snippet below with jQuery to search for the navigation link elements with the id (main-nav) assigned previously and add a click event handler to each link. When the user clicks on a link, the function will get the active link element and remove the active class style from it. Then add the active class style to the clicked link.


$('#main-nav li a').on('click', function() {
    var activeLink = $('.active');
    activeLink.removeClass('active'); 
    $(this).parent().addClass('active');
});

Monday, February 17, 2014

How to upload, update and save an image file to Google Drive using Javascript

This is a simple Javascript Google Drive example web app to load an image file from a local drive, write some text on the image, then save the edited image to Google Drive in the cloud. The basis of this example came from the Google Drive SDK Javascript Quickstart at this location https://developers.google.com/drive/quickstart-js. Read up the Google Drive SDK Javascript Quickstart to see how to enable the Google Drive API and setup a Google Drive Javascript web app.

Setup the Javascript app
Copy the following source code and save into your own html file. Change the string <YOUR_CLIENT_ID> to your own client ID assigned to you when you created your cloud project in http://cloud.google.com/console. Publish the page to a web server.

In general, this is what the Javascript code is doing: (1) load and draw the local image file in the canvas element, (2) draw the string "Hello World" onto the canvas, (3) save the canvas into an IMG element, (4) upload the IMG element source data into Google Drive.

<html>
<head>
<meta http-equiv="Content-type" content="text/html;charset=UTF-8">
<script type="text/javascript">
 
var CLIENT_ID = '<YOUR_CLIENT_ID>';
var SCOPES = 'https://www.googleapis.com/auth/drive';
 
/**
       * Called when the client library is loaded to start the auth flow.
       */
function handleClientLoad() {
window.setTimeout(checkAuth, 1);
}
 
/**
       * Check if the current user has authorized the application.
       */
function checkAuth() {
gapi.auth.authorize(
{'client_id': CLIENT_ID, 'scope': SCOPES, 'immediate': true},
handleAuthResult);
}
 
/**
       * Called when authorization server replies.
       *
       * @param {Object} authResult Authorization result.
       */
function handleAuthResult(authResult) {
var authButton = document.getElementById('authorizeButton');
var filePicker = document.getElementById('filePicker');
var uploadButton = document.getElementById('uploadButton');

authButton.style.display = 'none';
filePicker.style.display = 'none';
uploadButton.style.display = 'none';
if (authResult && !authResult.error) {
// Access token has been successfully retrieved, requests can be sent to the API.
filePicker.style.display = 'block';
filePicker.onchange = loadImageFile;
uploadButton.onclick = newUploadFile;
} else {
// No access token could be retrieved, show the button to start the authorization flow.
authButton.style.display = 'block';
authButton.onclick = function() {
gapi.auth.authorize(
{'client_id': CLIENT_ID, 'scope': SCOPES, 'immediate': false},
handleAuthResult);
};
}
}
 
function newUploadFile(evt){
gapi.client.load('drive','v2', function(){
var theImage = document.getElementById('editedImage');
var fileTitle = theImage.getAttribute('fileName');
var mimeType = theImage.getAttribute('mimeType');
var metadata = {
'title': fileTitle,
'mimeType': mimeType
};
var pattern = 'data:' + mimeType + ';base64,';
var base64Data = theImage.src.replace(pattern,'');            
newInsertFile(base64Data,metadata);
});
}
/**
       * Insert new file.
       *
       * @param {Image} Base 64 image data
       * @param {Metadata} Image metadata
       * @param {Function} callback Function to call when the request is complete.
       */
function newInsertFile(base64Data, metadata, callback){
const boundary = '-------314159265358979323846';
const delimiter = "\r\n--" + boundary + "\r\n";
const close_delim = "\r\n--" + boundary + "--";
var contentType = metadata.mimeType || 'application/octet-stream';
var multipartRequestBody =
delimiter +
'Content-Type: application/json\r\n\r\n' +
JSON.stringify(metadata) +
delimiter +
'Content-Type: ' + contentType + '\r\n' +
'Content-Transfer-Encoding: base64\r\n' +
'\r\n' +
base64Data +
close_delim;
 
var request = gapi.client.request({
'path' : '/upload/drive/v2/files',
'method' : 'POST',
'params' : {
'uploadType' : 'multipart'
},
'headers' : {
'Content-Type' : 'multipart/mixed; boundary="' + boundary + '"'
},
'body' : multipartRequestBody
});
if (!callback) {
callback = function (file) {
alert('done');
};
}
request.execute(callback);
}
function loadImageFile(evt){
var file = evt.target.files[0];
var reader = new FileReader();
reader.file = file;
reader.onload = onImageReaderLoad;
reader.readAsDataURL(file);            
}
function onImageReaderLoad(evt){
var file = this.file;
var mimeType = file.type;
writeSomeText(file.name,file.type,evt.target.result);        
}
/**
       * Write some Hello World text on an image using the canvas.
       *
       * @param {File Name} The name of the image file
       * @param {MimeType} The mime type of the image e.g. image/png
       * @param {Image} The image data
       */
function writeSomeText(sourceImageName, mimeType, sourceImage){
var resultsDiv = document.getElementById('resultsDiv');
var sourceImg = document.createElement('img');
var resultImg = document.createElement('img');
var canvas = document.createElement('canvas');
sourceImg.onload = function(evt){
canvas.width = this.width;
canvas.height = this.height;
var ctx = canvas.getContext('2d');
ctx.drawImage(this,0,0,canvas.width,canvas.height);
ctx.font = '24px Arial';
ctx.fillText('Hello World',this.width/2,this.height/2);
ctx.restore();
resultImg.onload = function(evt2){
resultImg.setAttribute('id','editedImage');
resultImg.setAttribute('mimeType', mimeType);
resultImg.setAttribute('fileName', sourceImageName);
resultsDiv.appendChild(resultImg);
var uploadButton = document.getElementById('uploadButton');
uploadButton.style.display = 'block';
};
resultImg.src = canvas.toDataURL(mimeType);
};
sourceImg.src = sourceImage;
}    
 
</script>
<script type="text/javascript" src="https://apis.google.com/js/client.js?onload=handleClientLoad"></script>
</head>
<body>
<!--Add a file picker for the user to choose an image file to be edited -->
<input type="file" id="filePicker" style="display: none" />
<!-- Add a button to start the upload process for loading the edited image file to Google Drive -->
<input type="button" id="uploadButton" style="display:none" value="Upload" />
<input type="button" id="authorizeButton" style="display: none" value="Authorize" />
<!-- div placeholder for displaying the edited image -->
<div id="resultsDiv">
</div>
</body>
</html>


Run the Javascript app

  1. Load the web page in an Internet browser.

    If the Javascript app has not been authorized by you, then the Authorize button will be displayed.
  2. Click Authorize.

    If you are not signed in to your Google account, the following page may display. Just type in your password and sign in.


    The Request for permission page appears.
  3. Click Accept.

    The app is authorized and the browser runs the Javascript app.
  4. Click Choose File.

    The Open dialog box appears.
  5. Browse and select an image file, e.g. ic_launcher.png. Click Open.

    The app writes the text string 'Hello World' in the middle of the selected image. The Upload button appears.

  6. Click the Upload button.

    A done message appears.

     The image is saved into your Google Drive in the cloud.
 

Monday, February 3, 2014

How to display a preview of CSS fonts in a Select Option drop down menu

The HTML Select Option element is normally used to display a list of options for users to make a choice. I wanted to use the option list for users to choose a font to use for further processing. I thought it would be nice to be able to show a preview of the fonts in the list itself, like how word processing software like Microsoft Word does it. I managed to figure how to do it by using some web fonts from Google, cascading style sheets (CSS) and a Web Font Loader.

In general, the following needs to be done in the HTML page: (1) download the web fonts you want to use in the select option list, (2) define style sheet classes for each font,  and (3) wrap each option with the optgroup tag and assign it with the style sheet class.

I managed to get this to work for Chrome and FireFox browsers but not for any of Microsoft's Internet Explorer browsers.

Download web fonts
In the header head tag section of the HTML file, make a link using the link tag to the web fonts you want to use. An example is shown below. Here, I am linking to the Allura and Dynalight fonts from Google.


<!DOCTYPE html> 
<html> 
<head> 
<title>Example font preview</title> 
<meta name="viewport"
content="width=device-width, initial-scale=1.0, user-scalable=no"> 
<meta charset="UTF-8"> 
<link href="../webappstyles.css" rel="stylesheet" type="text/css" />
<link href='http://fonts.googleapis.com/css?family=Allura' rel='stylesheet' type='text/css'>
<link href='http://fonts.googleapis.com/css?family=Dynalight' rel='stylesheet' type='text/css'>        


If you want to use the fonts in Javascript, then it would be wise to use the Web Font Loader to pre-load the fonts. This can be done by appending the font family names to the Web Font load method. The example code shows how this is done. The code can be included in the HTML head tag section.


<script src="//ajax.googleapis.com/ajax/libs/webfont/1.4.7/webfont.js"></script>
<script>
WebFont.load({
google: {
families: ['Allura', 'Dynalight']
}
});
</script>    


Define CSS classes
Inside the style tag section of the header, define a style sheet class for each font you want to use.


<style type="text/css">
.Allura { font-family: Allura, cursive; }
.Dynalight { font-family: Dynalight, cursive; }    
</style>

Wrap each option
In the select tag, wrap each option tag with the optgroup tag and assign the appropriate CSS style defined previously.


<select id="fontTypeCombo">
<optgroup class='Allura'>
<option>Allura</option>
</optgroup>
<optgroup class='Dynalight'>
<option>Dynalight</option>
</optgroup>
</select>

Now, when the HTML page is displayed in Chrome or FireFox, clicking on the select option combo box should display a list with a preview of the fonts.

Monday, June 24, 2013

Create bar charts on Google Maps

This Mapplet was developed to create bar charts (vertical or horizontal) on Google Maps from text files formatted as comma separated values (CSV). An example screenshot of vertical bar charts is shown below. 


Creating the bar charts is simple as shown below:

  1. Run the Mapplet by opening this link http://dominoc925-pages.appspot.com/mapplets/map_barcharts.html from any modern browser.
  2. Click Import CSV.

    The Import Comma Separated Values (CSV) File dialog appears.

    NoteThe CSV data must have a header row, geographic latitude and longitude columns to point to the locations to place the charts on.
  3. Click Choose File. Browse and select a CSV file. Alternatively, copy and paste the contents of a CSV file into the text box.

    The CSV data is loaded into the text box. The color scheme combo boxes for each CSV data column appear.

  4. If necessary, choose the correct CSV Delimiter, Latitude Column, and Longitude Column from the combo boxes.
  5. From the Chart Orientation field, choose either Vertical or Horizontal.
  6. Optional. Choose the chart size in pixels.
  7. In the Color scheme combo boxes, choose the colors to represent the CSV data columns.
  8. Click Create Charts.

    The horizontal bar charts are created.

  9.  The charts created can be clicked on to show the values. The charts can also be dragged and moved to a different location on the map if necessary.

Monday, February 18, 2013

Example KML for displaying extended data in balloons

In Google Earth, it is possible to display a nicely formatted Placemark balloon showing some relevant information about that Placemark. The simplest way to create the Placemark KML is to write and format everything (including the HTML mark ups) in the Placemark's Description tag, as shown in the example code below.
<Placemark>
<name>Microsoft</name>
<description>
<![CDATA[
<b>Example 1</b>
<table border="1" >
<tr><td>Company Name</td></tr>
<tr><td><i>Microsoft</i></td></tr>
</table>
]]>
</description>
<Point> <coordinates>-122.034924,37.331586,0</coordinates>
</Point>
</Placemark>

The screenshot shows how it is displayed in Google Earth.

However, if there are a lot of Placemarks, it would be a pain to have write the mark up and data values for everyone. It would be better to define a custom balloon style containing a template HTML mark up and placeholders for the variable data values once; the data values would then be stored under the Placemark's ExtendedData tag. When Google Earth renders the Placemark balloons, it would use the referenced balloon style and replace the placeholders with the actual data values from the Placemark's ExtendedData tags.

The example code below defines a balloon style with a placeholder $[Company_Name] in the HTML mark up text.
<Style id="MyBalloonStyle">
<BalloonStyle>
<text> <![CDATA[
<b>Example extended data template</b>
<table border="1" >
<tr><td>Company Name</td></tr>
<tr><td><i>$[Company_Name]</i></td></tr>
</table>
]]></text>
<bgColor>ffffffbb</bgColor>
</BalloonStyle>

Then in the Placemark tag, it is only necessary to place the data (name and value) under the ExtendedData tag as shown below. The balloon style is referenced with the StyleUrl tag.
<Placemark>
<name>Apple</name>
<styleUrl>#MyBalloonStyle</styleUrl>
<ExtendedData>
<Data name="Company_Name"><value>Apple Incorporated</value></Data>
</ExtendedData>
<Point> <coordinates>-122.034924,37.331586,0</coordinates>
</Point>
</Placemark>

The full KML code is shown below.


<?xml version="1.0" encoding="UTF-8"?>
<kml xmlns="http://www.opengis.net/kml/2.2">
<Document>
 
<Style id="MyBalloonStyle">
<BalloonStyle>
<text> <![CDATA[
<b>Example extended data template</b>
<table border="1" >
<tr><td>Company Name</td></tr>
<tr><td><i>$[Company_Name]</i></td></tr>
</table>
]]></text>
<bgColor>ffffffbb</bgColor>
</BalloonStyle>
<IconStyle> <color>ffffffff</color> <scale>1</scale>
<Icon><href>http://maps.google.com/mapfiles/kml/pushpin/grn-pushpin.png</href>
</Icon>
</IconStyle>
<LabelStyle> <scale>0</scale> </LabelStyle>
</Style>
<Folder> <name>Tech Companies</name>
<Placemark>
<name>Apple</name>
<styleUrl>#MyBalloonStyle</styleUrl>
<ExtendedData>
<Data name="Company_Name"><value>Apple Incorporated</value></Data>
</ExtendedData>
<Point> <coordinates>-122.034924,37.331586,0</coordinates>
</Point>
</Placemark>
<Placemark>
<name>Google</name>
<styleUrl>#MyBalloonStyle</styleUrl>
<ExtendedData>
<Data name="Company_Name"><value>Google Incorporated</value></Data>
</ExtendedData>
<Point> <coordinates>-122.084676,37.421742,0</coordinates>
</Point>
</Placemark>
</Folder>
</Document>
</kml>

The screenshot shows how it is rendered in Google Earth.

Monday, February 11, 2013

Example KML for displaying a photo image from the local disk

Recently I had to generate some Google Earth KML files for displaying photos from a local hard drive in a Placemark balloon. In order to display local images not from a web server, the file keyword must be used with 3 forward slashes in the HTML img tag followed by the full path of the photo file, as shown in the example KML code below.

 <?xml version="1.0" encoding="utf-8"?>  
 <kml>  
  <Document>  
   <name>Example of displaying a local image file</name>  
   <Placemark>  
    <name>Monaco</name>  
    <Snippet>Photo 1</Snippet>  
    <description><![CDATA[  
 <img src='file:///c:\temp\monaco\IMG_5523.jpg' width='400' /><br/&gt;  
 Photo taken from near the palace in Monaco<br/>  
 ]]>  
 </description>  
    <Point>  
     <coordinates>7.421630,43.731459</coordinates>  
    </Point>  
   </Placemark>  
  </Document>  
 </kml>  
The following screenshots show how this KML file is rendered in Google Earth.
 When the Placemark is clicked, the balloon pops up showing the local photo image file.