Showing posts with label Data translation. Show all posts

Monday, March 18, 2024

Convert North East Down (NED) to/from longitude,latitude and other various coordinate systems

The Koordinat2 web app (https://dominoc925-pages.appspot.com/webapp/koordinat2/default.html) has been upgraded to perform coordinate transformation between local coordinate system North East Down (NED) and many other coordinate systems including MGRS, geographic longitude/latitude, etc. 

This post shows the typical steps to perform the local NED conversion to other coordinate systems.

Define the NED local origin 

The local origin should be as near as possible to the area of interest. If it is too far away, the calculation rounding errors would result in erroneous converted coordinates.

  1. Use a browser to open the Koordinat2 web app url (https://dominoc925-pages.appspot.com/webapp/koordinat2/default.html).

    The Koordinat2 web app home page appears.


  2. Click the hamburger menu icon on the top left.

    The Navigation drawer opens.


  3. Click the Settings item.

    The Settings dialog appears.


  4. Choose the item North East Down reference origin.

    The NED Reference Origin appears.


  5. In the dialog, enter the reference origin Longitude, Latitude, and Altitude. Click Save.

    The Reference Origin is saved.

Define NED as the Primary coordinates (input)

  1. In the Primary coordinates card, click the gear icon.

    The Primary coordinates selection appears.


  2. Select North East Down from the list or search for it by clicking the Search icon and typing in NED.


Define the Secondary coordinates (output)

  1. In the Secondary coordinates card, click the gear icon.

    The Secondary coordinates selection appears.


  2. Select a desired coordinate system e.g. WGS 84 from the list or search for it by clicking the Search icon and typing in  WGS 84.


Enter NED coordinates

  1. In the Primary coordinates card, type in the North, East, and Down values.

    The NED values are converted to the secondary coordinates. And a marker appears on the map.


Monday, July 22, 2019

Convert multiple images to WebP format using Android Studio

WebP (https://en.wikipedia.org/wiki/WebP) is a lossy and lossless compressed image format with a resultant file size smaller than JPEG. Using Android Studio, you can easily convert one or more images intoWebP format.
  1. Run Android Studio and open a project.
  2. In the Project pane on the left, select one or more images.


  3. Press the mouse right button. In the pop up menu, choose Convert to WebP....

    The Converting Images to WebP dialog box appears.

  4. Optional. If necessary, change the parameters e.g. encoding. Click OK.

    The Preview and Adjust Converted Images dialog box appears.

  5. Optional. If necessary, adjust the quality parameter. Click Next to preview the next conversion, or click Accept All to convert all images.

    The images are converted to WebP.

Monday, May 6, 2019

Export Velodyne PCAP to LAS files in VeloView

VeloView is an open source application for working with Velodyne's popular LiDAR sensors (HDL-64E, HDL-32E, VLP-16 etc.). It is available from this website https://www.paraview.org/veloview/.

VeloView has an export to LAS file format command but you would not know it as it is not available from the graphical user interface. To generate LAS files, it is necessary to use the Python command line interface. The steps below show how it can be done.
  1. Run VeloView and load a Velodyne PCAP file.

  2. Choose Tools | Python Console.

    The Python Console appears.
  3. To export out the current frame, type in the following command at the Python prompt.

    >>> vv.saveLASCurrentFrame('c:/path/to/output.las', 0)

    Note 1: the last argument indicates the coordinate transformation mode. 0 = raw, 1 = absolute, 2 = relative.
    Note 2: Replace c:/path/to/ with your actual file system path
  4. To export a range of frames by frame numbers, type in the following command at the Python prompt.

    >>> vv.saveLASFrames('c:/path/to/output.las', 10, 20, 0)

    Note: in this example, 10 is the starting frame, 20 is the ending frame, and 0 is the raw transformation mode.
  5. To export a list of frames by time steps, type in the following command at the Python prompt.

    >>> vv.saveLAS('c:/path/to/output/las', timesteps, 0)

    Note: timesteps is an array of integers specifying the time steps e.g. [0,1,2,...10] and 0 is the raw transformation mode.

    To get the available time steps in the PCAP file, type in the following command at the Python prompt.

    >>> timesteps = vv.getCurrentTimesteps()
  6. Optional. Display the resultant LAS file in a viewer.

Monday, December 3, 2018

Use PDAL to export colored LAS file to Point Cloud XYZ format text file

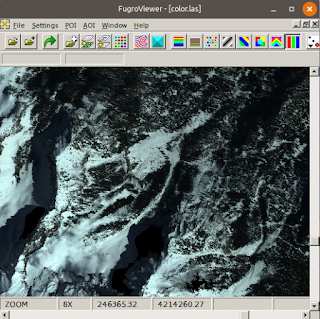
PDAL can be used to export out a colored laser LAS file like the one in the screenshot below into a text file in Point Cloud XYZ format, which is just an ASCII text file with each point in a row of X, Y, Z, R, G, B values.

To use PDAL to perform the conversion, follow the following steps.
  1. In Windows, open up an OSGeo4W Shell.


  2. In the command prompt, change directory to the folder containing the LAS file e.g. D:\Temp\data\.

  3. Use a text editor to create a PDAL pipeline JSON file, e.g. las2xyz.json, with the following contents.

    {
      "pipeline":[
        {
          "type":"readers.las",
          "filename":"color.las"
        },
        {
          "type":"writers.text",
          "format":"csv",
          "order":"X,Y,Z,RED:0,GREEN:0,BLUE:0",
          "keep_unspecified":"false",
       "quote_header": "false",
       "delimiter": " ",
          "filename":"outputfile.xyz"
        }
      ]
    }
    

    where color.las is the name of the input LAS file
    and outputfile.xyz is obviously the name of the output XYZ file.
  4. In the command prompt, type in the following command to perform the conversion.

    D:\> pdal pipeline las2xyz.json
  5. Press Enter.

    The X, Y, Z, R, G, B values of the LAS file are exported out into the text Point Cloud XYZ file.

Monday, January 22, 2018

Using QGIS to export CSV files with Well Known Text geometry

QGIS can export feature layers as comma separated values (*.CSV) files with a geometry column in  Well Known Text (WKT) format. This can be very convenient if you want to exchange a small amount of data from one GIS system to another GIS system.

To save a vector feature layer to a WKT CSV file, do the following:

  1. In the legend pane of QGIS, select a layer to export, e.g. forest. Then press the right click of the mouse.

    A pop up menu appears.

  2. In the pop up menu, choose Save As.
  3. The Save vector layer as dialog box appears.


  4. In the Format combo box, choose Comma Separated Values (CSV). In the File name field, click the  Browse button and type in the output file name, e.g. forest.csv.


  5. In the Layer Options group box's GEOMETRY combo box, choose AS_WKT. Click OK.

    The selected vector layer is exported out as a CSV file with a geometry field as WKT format as shown below in a spread sheet.

Monday, January 25, 2016

WebApp for batch conversion of SVG vector files to raster PNG/JPEG images

This is a simple HTML5 WebApp for converting one or more SVG format files into raster image files in PNG or JPEG formats. At the same time, the user can choose to resultant raster image dimensions, whether it will be scaled at 25%, 50%, 75% or at a custom scale. The HTML5 canvas element is used to perform the conversion locally using the user's Internet browser without having to upload the SVG file to the web server.

  1. To run this WebApp, go to https://dominoc925-pages.appspot.com/webapp/svgimg/


  2. Optional. Click Settings on the right pane and change the Background color, transparency, scale factor, or the image format.


  3. Simply drag and drop the SVG files into the dashed box. Or click the Choose Files button and select one or more SVG files.


    The SVG file(s) are converted to raster image format.
  4. To save the converted image(s) one by one, just right click on the image and choose Save image as. Alternatively, click Main | Generate zip file on the right pane to generate a zip file containing all the converted images.


Monday, August 11, 2014

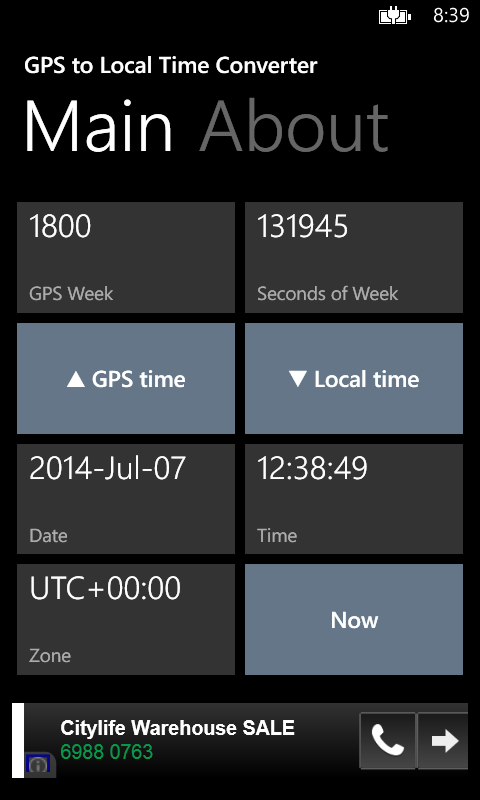
Windows Phone 8 App for converting GPS Week time and local time

The date time used by the Global Positioning System (GPS) date time is normally expressed as a week number and a seconds-of-week number. This format is not as easy to work with as a normal calendar date time. This app can help to convert the GPS week-seconds format into the equivalent local date time and vice-versa. It has the option to choose which local UTC time zone to use for conversion. The app will automatically adjust the local time for GPS leap seconds.

This Windows Phone app is based on a similar app written for Android earlier. The app was written as an exercise to learn the ins and outs of developing for the Windows Phone 8 platform. It turned out that the app has to be rewritten from scratch as the two platforms are not the same, especially the look and the behavior has to be specially tailored to the platform.

Using the Windows Phone app is simple. Just click on the GPS Local Time tile to launch the app.


Convert from GPS week and seconds of week to the local time

  1. Tap the GPS week button to set the source GPS week number in the picker screen.


  2. Tap the GPS seconds of week button to set the source GPS seconds of week number in the picker screen.
  3. Optional. Tap the Zone button to set the destination UTC zone in the picker list.


  4. Tap the To Local time button to do the conversion.

    The GPS time is converted to the equivalent local date time.
Convert from the local date time to GPS week time
  1. Optional. Tap the Zone button and choose a source UTC zone in the picker.
  2. Tap the Date button and choose the source date in the picker.


  3. Tap the Time button and choose the source time in the picker.


  4. Tap the To GPS Time button.

    The local date time is converted to the equivalent GPS week, seconds time.
Display the current GPS and Local time
  1. Optional. Tap the Zone button and choose the destination UTC zone in the picker.
  2. Tap the Now button.

    The current GPS week, seconds and local date, time are displayed.

The app can be downloaded from the Windows Phone store.


Monday, May 26, 2014

QGIS Export layers to SVG for cartographic editing in desktop publishing software

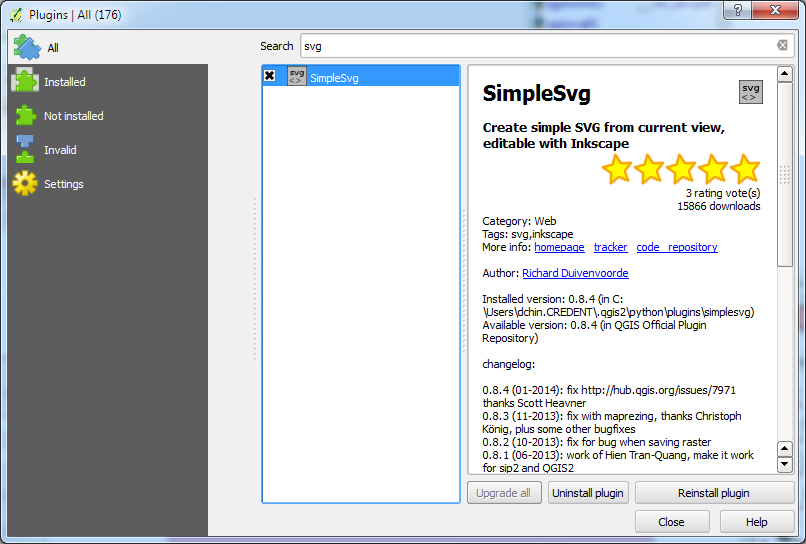
If there is a need to manipulate QGIS map layers for cartographic publishing purposes in vector editing software like Adobe Illustrator or the free and open source software Inkscape, there is a plugin - Simple SVG for that. The plugin is not perfect but it gives you probably enough to work on.

If the plugin is not installed in QGIS, simply run select Plugins | Manage and install Plugins... Then search for SimpleSvg, as shown below. Once located, just install it. There will be a Web pull down menu and an SVG icon in the tool bar.


  1. Using SimpleSvg is simple. Just display the layers you want to export to SVG. Resize the map view until you are happy with the extent.


  2. Then select Web | Save as SVG | Save as SVG.

    The SimpleSvg dialog box appears.

  3. Type in the output SVG file path and name.

    Note: On Windows, clicking the browse button will cause a Python error. So just key in the output file path and name.

  4. Click OK.

    The SVG file is created.

  5. Open the resultant SVG file in a vector editing software such as Inkscape. Further cartographic editing can now be done on the resultant vector graphics.


    Note: There is a bounding box feature in the resultant layer named qgisviewbox.
    Each map feature is placed in its own layer, e.g. waterbody.
    Each map feature is grouped together
    .


Monday, May 12, 2014

Import OpenStreetMap features into QGIS

QGIS 2.2 has a built in function to import OpenStreetMap features into a SpatiaLite database. Using the function requires us to perform three basic steps:
  • Download data
  • Import topology from XML
  • Export topology to SpatiaLite
The following steps illustrate how to import OpenStreetMap features into QGIS.

Download data
  1. Start QGIS. Optional: Navigate the map view to the area where you want to download OpenStreetMap features.


  2. Select Vector | OpenStreetMap | Download data.

    The Download OpenStreetMap data dialog box appears.

  3. Optional. Choose an extent method e.g. From map canvas.
  4. In the Output file field, click the [...] button.

    The Save As dialog box appears.

  5. Type in a file name, e.g. fortaleza.osm. Click Save. Click OK.

    The OpenStreetMap data has been downloaded.

  6. Click OK. Click Close.
Import topology from XML
  1. Select Vector | OpenStreetMap | Import topology from XML.

    The OpenStreetMap Import dialog box appears.

  2. In the Input XML file (*.osm) field, click the [...] button.

    The Open dialog box appears.

  3. Browse and select the previously downloaded *.osm file, e.g. fortaleza.osm. Click Open.

    The Output SpatiaLite DB file and Connection name fields are populated with default values.

  4. Click OK.

    The OpenStreetMap tables are imported into the SpatiaLite DB.

  5. Click OK. Click Close.
     
Export topology to SpatiaLite.
  1. Select Vector | OpenStreetMap | Export topology to SpatiaLite.

    The Export OpenStreetMap topology to SpatiaLite dialog box appears.

  2. In the Input DB file field, click the [...] button.

    The Open dialog box appears.
  3. Browse and select the previously created SpatiaLite DB file, e.g. fortaleza.osm.db. Click Open.
  4. In the Export type field, toggle on a geometry feature type, e.g. Polylines.


  5. Optional. In the Output layer name field, type in a layer name to use, e.g. fortaleza_polylines.
  6. Click OK.

    The layer is created in QGIS.
  7. Click OK.


  8. Optional. Repeat the previous steps 4-6 for additional geometry types.
  9. Click Close.