- To run this WebApp, go to https://dominoc925-pages.appspot.com/webapp/svgimg/

- Optional. Click Settings on the right pane and change the Background color, transparency, scale factor, or the image format.

- Simply drag and drop the SVG files into the dashed box. Or click the Choose Files button and select one or more SVG files.

The SVG file(s) are converted to raster image format.
- To save the converted image(s) one by one, just right click on the image and choose Save image as. Alternatively, click Main | Generate zip file on the right pane to generate a zip file containing all the converted images.


About Geospatial Applications, FME, Visual Studio, gvSIG, Global Mapper, Programming, LiDAR, GIS, Google Maps, SAGA GIS, Android, QGIS
Showing posts with label HTML5.. Show all posts
Showing posts with label HTML5.. Show all posts
Monday, January 25, 2016
WebApp for batch conversion of SVG vector files to raster PNG/JPEG images
This is a simple HTML5 WebApp for converting one or more SVG format files into raster image files in PNG or JPEG formats. At the same time, the user can choose to resultant raster image dimensions, whether it will be scaled at 25%, 50%, 75% or at a custom scale. The HTML5 canvas element is used to perform the conversion locally using the user's Internet browser without having to upload the SVG file to the web server.


Monday, April 21, 2014
A simple Chrome Web App for creating animated GIF files
 Recently, it seems animated GIFs have been making a come back and used on social networks like Google+. I thought of making a simple Chrome Web App for creating the animated GIF files (using only Javascript, HTML5 and the gif.js library) without having to upload to a server for processing, i.e. the processing takes place within the web browser only. The resultant WebApp is available here on http://dominoc925-pages.appspot.com/webapp/gifanim/default.html.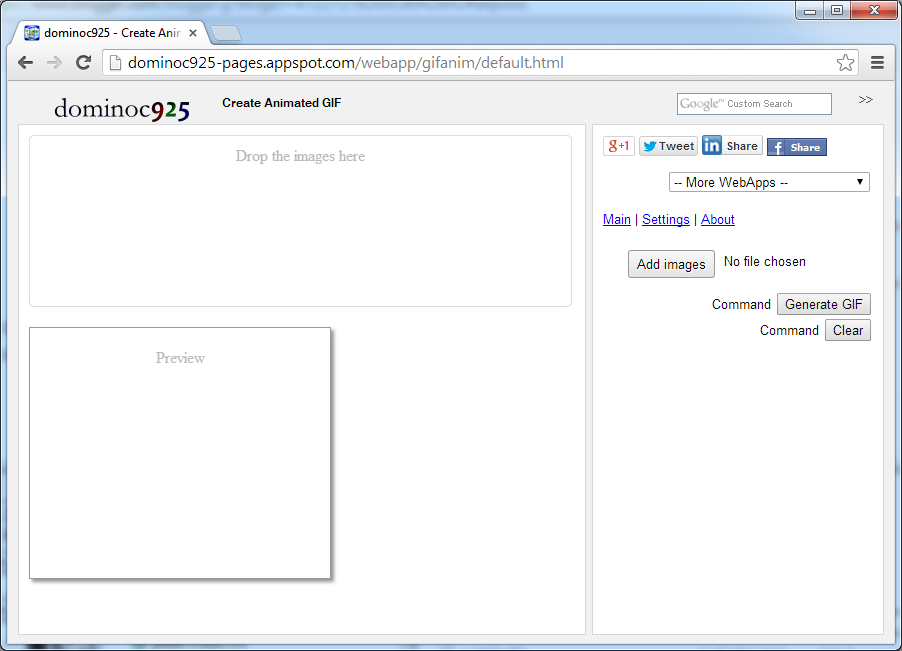
Using the WebApp is easy. The following steps show how to create an animated GIF with the default settings.
- Simply drag and drop the image frames into the box provided. Or click the Add Image button.
The Open dialog box appears.
- Select one or more image files. Click Open.
The thumbnails of the selected files appear in the box.
- Click Generate GIF.
The animated GIF file is created.
- To save the animated GIF file, mouse right click on the animation. Select Save Image As.

The Save As dialog appears. - Type in a file name. Click Save.
The animated GIF file is saved.
Delete or change the order of the image frames
- If you want to change the order of the images, simply click on the image thumbnail.
The Move previous, delete, and Move next icons appear below the thumbnail.
- Click Move previous to move the selected image before the previous image frame.
- Click Move next to move the selected image after the next image frame.
- Click Delete to delete the selected image.
Changing the default settings
- If you want to change the default settings, click on Settings on the right pane.

- In the Quality field, choose another value.
- In the Animation speed field, choose another value.
- In the Repeat field, choose another value.
- In the Canvas size field, choose another value.
- Click Generate GIF to see the effects.
Monday, February 17, 2014
How to upload, update and save an image file to Google Drive using Javascript
This is a simple Javascript Google Drive example web app to load an image file from a local drive, write some text on the image, then save the edited image to Google Drive in the cloud. The basis of this example came from the Google Drive SDK Javascript Quickstart at this location https://developers.google.com/drive/quickstart-js. Read up the Google Drive SDK Javascript Quickstart to see how to enable the Google Drive API and setup a Google Drive Javascript web app.
Setup the Javascript app
Copy the following source code and save into your own html file. Change the string <YOUR_CLIENT_ID> to your own client ID assigned to you when you created your cloud project in http://cloud.google.com/console. Publish the page to a web server.
In general, this is what the Javascript code is doing: (1) load and draw the local image file in the canvas element, (2) draw the string "Hello World" onto the canvas, (3) save the canvas into an IMG element, (4) upload the IMG element source data into Google Drive.
Run the Javascript app
Setup the Javascript app
Copy the following source code and save into your own html file. Change the string <YOUR_CLIENT_ID> to your own client ID assigned to you when you created your cloud project in http://cloud.google.com/console. Publish the page to a web server.
In general, this is what the Javascript code is doing: (1) load and draw the local image file in the canvas element, (2) draw the string "Hello World" onto the canvas, (3) save the canvas into an IMG element, (4) upload the IMG element source data into Google Drive.
<html>
<head>
<meta http-equiv="Content-type" content="text/html;charset=UTF-8">
<script type="text/javascript">
var CLIENT_ID = '<YOUR_CLIENT_ID>';
var SCOPES = 'https://www.googleapis.com/auth/drive';
/**
* Called when the client library is loaded to start the auth flow.
*/
function handleClientLoad() {
window.setTimeout(checkAuth, 1);
}
/**
* Check if the current user has authorized the application.
*/
function checkAuth() {
gapi.auth.authorize(
{'client_id': CLIENT_ID, 'scope': SCOPES, 'immediate': true},
handleAuthResult);
}
/**
* Called when authorization server replies.
*
* @param {Object} authResult Authorization result.
*/
function handleAuthResult(authResult) {
var authButton = document.getElementById('authorizeButton');
var filePicker = document.getElementById('filePicker');
var uploadButton = document.getElementById('uploadButton');
authButton.style.display = 'none';
filePicker.style.display = 'none';
uploadButton.style.display = 'none';
if (authResult && !authResult.error) {
// Access token has been successfully retrieved, requests can be sent to the API.
filePicker.style.display = 'block';
filePicker.onchange = loadImageFile;
uploadButton.onclick = newUploadFile;
} else {
// No access token could be retrieved, show the button to start the authorization flow.
authButton.style.display = 'block';
authButton.onclick = function() {
gapi.auth.authorize(
{'client_id': CLIENT_ID, 'scope': SCOPES, 'immediate': false},
handleAuthResult);
};
}
}
function newUploadFile(evt){
gapi.client.load('drive','v2', function(){
var theImage = document.getElementById('editedImage');
var fileTitle = theImage.getAttribute('fileName');
var mimeType = theImage.getAttribute('mimeType');
var metadata = {
'title': fileTitle,
'mimeType': mimeType
};
var pattern = 'data:' + mimeType + ';base64,';
var base64Data = theImage.src.replace(pattern,'');
newInsertFile(base64Data,metadata);
});
}
/**
* Insert new file.
*
* @param {Image} Base 64 image data
* @param {Metadata} Image metadata
* @param {Function} callback Function to call when the request is complete.
*/
function newInsertFile(base64Data, metadata, callback){
const boundary = '-------314159265358979323846';
const delimiter = "\r\n--" + boundary + "\r\n";
const close_delim = "\r\n--" + boundary + "--";
var contentType = metadata.mimeType || 'application/octet-stream';
var multipartRequestBody =
delimiter +
'Content-Type: application/json\r\n\r\n' +
JSON.stringify(metadata) +
delimiter +
'Content-Type: ' + contentType + '\r\n' +
'Content-Transfer-Encoding: base64\r\n' +
'\r\n' +
base64Data +
close_delim;
var request = gapi.client.request({
'path' : '/upload/drive/v2/files',
'method' : 'POST',
'params' : {
'uploadType' : 'multipart'
},
'headers' : {
'Content-Type' : 'multipart/mixed; boundary="' + boundary + '"'
},
'body' : multipartRequestBody
});
if (!callback) {
callback = function (file) {
alert('done');
};
}
request.execute(callback);
}
function loadImageFile(evt){
var file = evt.target.files[0];
var reader = new FileReader();
reader.file = file;
reader.onload = onImageReaderLoad;
reader.readAsDataURL(file);
}
function onImageReaderLoad(evt){
var file = this.file;
var mimeType = file.type;
writeSomeText(file.name,file.type,evt.target.result);
}
/**
* Write some Hello World text on an image using the canvas.
*
* @param {File Name} The name of the image file
* @param {MimeType} The mime type of the image e.g. image/png
* @param {Image} The image data
*/
function writeSomeText(sourceImageName, mimeType, sourceImage){
var resultsDiv = document.getElementById('resultsDiv');
var sourceImg = document.createElement('img');
var resultImg = document.createElement('img');
var canvas = document.createElement('canvas');
sourceImg.onload = function(evt){
canvas.width = this.width;
canvas.height = this.height;
var ctx = canvas.getContext('2d');
ctx.drawImage(this,0,0,canvas.width,canvas.height);
ctx.font = '24px Arial';
ctx.fillText('Hello World',this.width/2,this.height/2);
ctx.restore();
resultImg.onload = function(evt2){
resultImg.setAttribute('id','editedImage');
resultImg.setAttribute('mimeType', mimeType);
resultImg.setAttribute('fileName', sourceImageName);
resultsDiv.appendChild(resultImg);
var uploadButton = document.getElementById('uploadButton');
uploadButton.style.display = 'block';
};
resultImg.src = canvas.toDataURL(mimeType);
};
sourceImg.src = sourceImage;
}
</script>
<script type="text/javascript" src="https://apis.google.com/js/client.js?onload=handleClientLoad"></script>
</head>
<body>
<!--Add a file picker for the user to choose an image file to be edited -->
<input type="file" id="filePicker" style="display: none" />
<!-- Add a button to start the upload process for loading the edited image file to Google Drive -->
<input type="button" id="uploadButton" style="display:none" value="Upload" />
<input type="button" id="authorizeButton" style="display: none" value="Authorize" />
<!-- div placeholder for displaying the edited image -->
<div id="resultsDiv">
</div>
</body>
</html>
Run the Javascript app
- Load the web page in an Internet browser.
If the Javascript app has not been authorized by you, then the Authorize button will be displayed.
- Click Authorize.
If you are not signed in to your Google account, the following page may display. Just type in your password and sign in.
The Request for permission page appears.
- Click Accept.
The app is authorized and the browser runs the Javascript app.
- Click Choose File.
The Open dialog box appears.
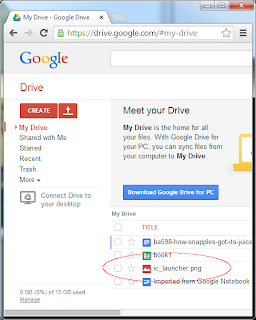
- Browse and select an image file, e.g. ic_launcher.png. Click Open.
The app writes the text string 'Hello World' in the middle of the selected image. The Upload button appears.
- Click the Upload button.
A done message appears.
The image is saved into your Google Drive in the cloud.


Monday, June 24, 2013
Create bar charts on Google Maps
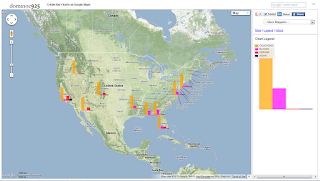
This Mapplet was developed to create bar charts (vertical or horizontal) on Google Maps from text files formatted as comma separated values (CSV). An example screenshot of vertical bar charts is shown below.
Creating the bar charts is simple as shown below:

Creating the bar charts is simple as shown below:
- Run the Mapplet by opening this link http://dominoc925-pages.appspot.com/mapplets/map_barcharts.html from any modern browser.
- Click Import CSV.
The Import Comma Separated Values (CSV) File dialog appears.
Note: The CSV data must have a header row, geographic latitude and longitude columns to point to the locations to place the charts on. - Click Choose File. Browse and select a CSV file. Alternatively, copy and paste the contents of a CSV file into the text box.
The CSV data is loaded into the text box. The color scheme combo boxes for each CSV data column appear.
- If necessary, choose the correct CSV Delimiter, Latitude Column, and Longitude Column from the combo boxes.
- From the Chart Orientation field, choose either Vertical or Horizontal.
- Optional. Choose the chart size in pixels.
- In the Color scheme combo boxes, choose the colors to represent the CSV data columns.
- Click Create Charts.
The horizontal bar charts are created.
- The charts created can be clicked on to show the values. The charts can also be dragged and moved to a different location on the map if necessary.


Monday, February 25, 2013
HTML5 Picture Text WebApp for making social network picture status message
 Using HTML5 and a great Canvas Javascript library Fabricjs, I made a simple web app for placing text string on images for sharing on social networks like Facebook, Google+ or Twitter. One or more text strings can be placed on the canvas. Once placed, the text can be edited, rotated, scaled, stretched or styled with different fonts and stroked. The background can be a plain color fill or a user defined image - the image can be set with some opacity value.
To run the web app, go to http://dominoc925-pages.appspot.com/webapp/picture_text/default.html.

Change the canvas
- On the right pane, click Settings.

- In the Canvas width field, type in a new width (in pixels) e.g. 800.
- In the Canvas height field, type in a new height (in pixels) e.g. 600.
- In the Canvas fill color field, pick a new background color e.g. grey.
- To use an image for the background, choose Image in the Background combo box.
Additional fields appear.
- Click the Choose File button. Choose an image.
The image is displayed in the canvas.
- To change the image opacity, type in a value between 0 and 1 in the Background image opacity field.

Placing text
- On the right pane, click Add new text.
The Add text dialog appears.
- Type in any text string in the Text string field.
- Optional. Choose a font, font style, effects, line spacing, text alignment, text fill color from the various combo boxes.
- Click Okay.
The text string is placed randomly on the canvas.
- Close the dialog.


Move, rotate, resize, stretch the text
- Select the text string on the canvas.
Handles appear around the text string. - To move the text, just drag it to a new location.
- To resize the text, just press down SHIFT and drag the corner handles (four sided arrow cursor).
- To rotate the text, just drag the corner handles (diagonal double headed arrow cursor).

- To stretch the text, just drag the side handles (vertical or horizontal double headed arrow cursor).

Changing the text properties
- Select the text string on the canvas.
The Properties and Delete buttons appear on the right pane.
- On the right pane, click Properties.
The Update text dialog appears.
- To change the text string, just type in new text in the Text string field.
- To change the font, style, effects, line spacing, or text alignment, use the combo boxes.
- To change the text fill color, just pick another color in the Text fill color picker field.
- To apply a stroke around the text, toggle on Stroke text. Then choose a color from the Text stroke color picker field. Choose a text stroke width in the Text stroke width field.
- Click Okay.
The text string is updated.
- Close the dialog.


Creating the picture text image file
- On the right pane, click Export image.
The text is composited with the background and a new window of the PNG image pops up. - Right click on the image. Choose Save image as.

- Type in a file name and save the image.

Monday, December 31, 2012
Display Shapefiles on Google Maps with this Google Mapplet
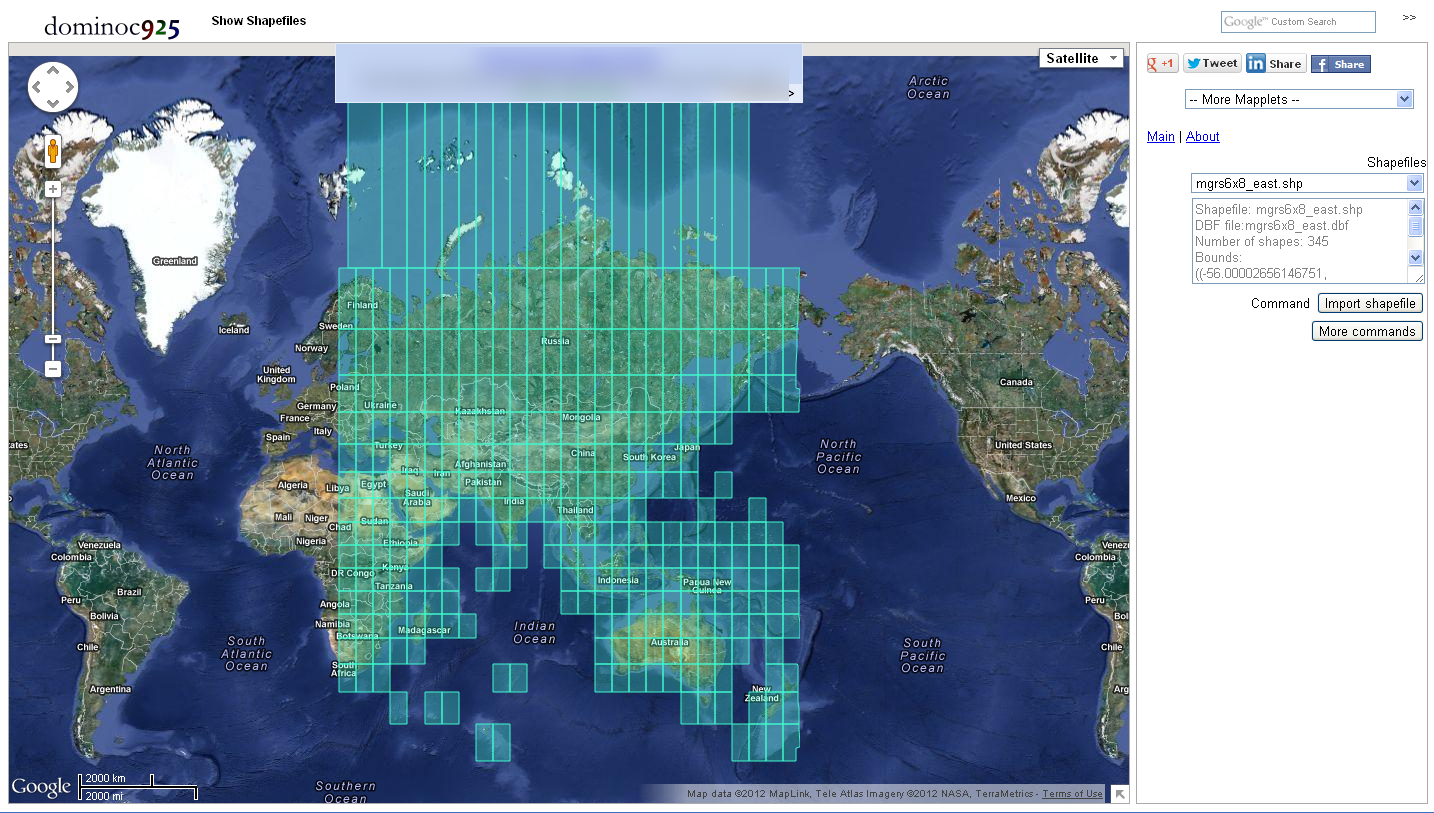
It would be nice to import and overlay ESRI Shapefiles over a Google Maps backdrop without having to upload the files to a web server. With the new HTML5 FileReader objects implemented in modern browsers, it is now possible to do this. I burnt some midnight oil to write this tool to read, reproject to the Mercator coordinate system, and display Shapefiles as Google Maps overlays.
The following steps demonstrate how to use the tool.
The following steps demonstrate how to use the tool.
- Use a modern browser (such as Chrome or FireFox) to open this page http://dominoc925-pages.appspot.com/mapplets/vshpfile.html.

- Click Import shapefile.
The Import Shapefile dialog box appears.
- In the SHP field, click the Choose File button. Browse and select a Shapefile e.g. mgrs6x8_east.shp.

- In the DBF field, click the Choose File button. Browse and select the Shapefile's corresponding DBF file e.g. mgrs6x8_east.dbf.

- In the Coordinate system type field, choose the correct system for the Shapefile e.g. Geographic. If Projected is chosen, then choose the correct Projection.

- In the Geodetic Datum field, choose the correct datum e.g. WGS84.
- Click Start Import.
If all goes well, the Shapefile will be displayed on the Google Maps backdrop. It might be necessary to zoom into the Shapefile's bounds by clicking the More commands | Fit shapefile buttons on the sidebar.

- Click on the Shapefile overlay to display the DBF attributes in an Info window.

- Repeat to display more Shapefiles.



Monday, December 24, 2012
WebApp to show DBASE (*.dbf) file information
The ESRI Shapefile format stores database attributes in DBASE DBF (*.dbf) file and shape geometries in another associated file (*.shp). Using the DBASE file structure documentation in http://www.dbf2002.com/dbf-file-format.html, I wrote a simple Javascript web app to show basic information about a DBF file, similar to the open source ShapeLib's dbfinfo executable.
The web app can be run from this page http://dominoc925-pages.appspot.com/webapp/dbf_info/default.html.
The web app can be run from this page http://dominoc925-pages.appspot.com/webapp/dbf_info/default.html.
- To use the web app, simply drag and drop one or more DBASE files (*.dbf) into the dashed box as shown in the screenshot below.

- Or click the button and choose one or more (*.dbf) files. .

Basic information about the DBF file is displayed, including the number of records, the number of columns, column names and type.


Note: This will run only on Chrome and a development version of FireFox that uses Gecko 7 at the moment.
Monday, December 17, 2012
WebApp to show Shapefile information
I wrote a simple HTML5 Web App to show basic information about one or more ESRI Shapefile (*.shp) files similar to the shpinfo command from the open source ShapeLib library. The processing of the Shapefile is done in the local web browser without having to upload it to a server. The web app can be run from this web site http://dominoc925-pages.appspot.com/webapp/shpfile_info/default.html.
One the page is displayed, either click the button and select one or more Shapefiles or drag and drop *.shp files into the dashed box as shown in the screenshots below.


One the page is displayed, either click the button and select one or more Shapefiles or drag and drop *.shp files into the dashed box as shown in the screenshots below.


The Shapefile information is displayed in the web page.

Subscribe to:
Posts (Atom)
