Showing posts with label OSGeo4W. Show all posts

Monday, December 3, 2018

Use PDAL to export colored LAS file to Point Cloud XYZ format text file

PDAL can be used to export out a colored laser LAS file like the one in the screenshot below into a text file in Point Cloud XYZ format, which is just an ASCII text file with each point in a row of X, Y, Z, R, G, B values.

To use PDAL to perform the conversion, follow the following steps.
  1. In Windows, open up an OSGeo4W Shell.


  2. In the command prompt, change directory to the folder containing the LAS file e.g. D:\Temp\data\.

  3. Use a text editor to create a PDAL pipeline JSON file, e.g. las2xyz.json, with the following contents.

    {
      "pipeline":[
        {
          "type":"readers.las",
          "filename":"color.las"
        },
        {
          "type":"writers.text",
          "format":"csv",
          "order":"X,Y,Z,RED:0,GREEN:0,BLUE:0",
          "keep_unspecified":"false",
       "quote_header": "false",
       "delimiter": " ",
          "filename":"outputfile.xyz"
        }
      ]
    }
    

    where color.las is the name of the input LAS file
    and outputfile.xyz is obviously the name of the output XYZ file.
  4. In the command prompt, type in the following command to perform the conversion.

    D:\> pdal pipeline las2xyz.json
  5. Press Enter.

    The X, Y, Z, R, G, B values of the LAS file are exported out into the text Point Cloud XYZ file.

Monday, February 26, 2018

Use PDAL to register a point cloud to control points

Sometimes, some 3D LiDAR point cloud data are not at the correct location or they are not aligned with other point clouds. When this happens, at least 3 control points from the point cloud and the reference need to be identified and a transformation matrix (usually a 4x4 homogeneous matrix) be calculated.

Once the matrix has been calculated, PDAL's transformation filter can then be used to perform the registration or transformation of the point cloud to the reference.

While PDAL can apply the transformation, it does not have a tool for calculating the matrix. This has to be done externally. This post uses a simple WebApp calculator at this site https://dominoc925-pages.appspot.com/webapp/calc_transf3d/default.html to calculate a rigid 4x4 transformation matrix given 2 corresponding sets of 3 or more control points.

Identifying 2 sets of corresponding control points

  1. Using a point cloud viewer such as FugroViewer, identify 3 or more source control points from the unregistered point cloud., e.g. p1, p2, p3 and p4.


  2. Using a GPS receiver or from a database, identify the corresponding points from the destination reference system.


Calculating the 4x4 transformation matrix
  1. Open up url https://dominoc925-pages.appspot.com/webapp/calc_transf3d/default.html in an Internet browser.
  2. In the Source 3D points field, type or paste in the source control point coordinates from the previous section.


  3. In the Destination 3D points field, type or paste in the corresponding control points from the destination reference system from the previous section.
  4. Click Calculate.

    The 4x4 transformation matrix and root mean square error is calculated.


    Note: if the RMSE is large, then there may be some error in the input coordinates.
  5. Using a text editor, create a PDAL pipeline JSON file which specifies the input, filter, and output. Copy and paste the 4x4 transformation matrix into the matrix field in the JSON file as shown below. Replace the commas with blanks. 
{
  "pipeline":[
    "input.laz",
    {
      "type":"filters.transformation",
      "matrix":"
0.21095277662308629 0.9774781497556848 -0.00594918357528593 23238.318780198064 
-0.9774332258657229 0.21100438075203337 0.01007175640974158 30100.055196603218 
0.011100225616467532 0.0036902647131527543 0.9999315811282344 32.53070599039722 
0 0 0 1"
    },
    {
      "type":"writers.las",
   "compression": "laszip",
      "filename":"output.laz"
    }
  ]
}

Running the transformation

  1. In Windows, open up the OSGeo4W command prompt.

    The Administrator: OSGeo4W Shell appears.


  2. In the Command Prompt, type in the following and press RETURN:

    C:> pdal pipeline transform_pipeline.json

    where transform_pipeline.json is the JSON file created in the previous section.

    The point cloud is transformed.

Monday, December 11, 2017

Generating LiDAR flight line boundaries with PDAL's tindex

A common task after an airborne LiDAR data collection is to determine the boundaries of the LiDAR LAS file strips, to visualize where they cover approximately. The screenshot below shows an example of how these LiDAR strips look like, colored by elevation. 
Example of LiDAR data strips
The boundaries can be generated in various formats using PDAL's tindex command. Using this command is simple, as shown in the example steps below:

  1. Open up the OSGeo4W Command Prompt. Change the directory to the folder containing the *.laz files.

    A folder containing LiDAR *.las file strips

    1. At the prompt, type in the command:

      C:\> pdal tindex boundary.sqlite *.laz -f SQLite --lyr_name "bnd"

      where boundary.sqlite is the output file
      *.laz specifies the input files using a wildcard
      -f SQLite is the output format
      --lyr_name "bnd" specifies the layer name to append to the output name
    2. Press RETURN.

      The boundaries are generated.

    3. Optional. After the process is completed, drag and drop the output file e.g. boundary.sqlite onto QGIS.

      The LiDAR strips boundary_bnd_polygon are displayed.


      The output boundaries have the following attributes as shown below.


    Tuesday, July 25, 2017

    Using Orfeo ToolBox to combine grayscale TIFF images into RGB and CIR composites

    For working with geo-referenced TIFF images, Orfeo ToolBox (OTB) provides a useful convenience function otbcli_concatenateImages to combine separate grayscale images into a composite file. Examples of separate bands of grayscale images are shown below.

    For instance, the separate grayscale bands representing the red, green and blue channels can be combined into a single RGB composite image. To do this using OTB, the following steps can be done.

    1. Open up a OSGeo4W Command Prompt.
    2. At the prompt, type in the otbcli_concatenateImages command with options:

      C:\> otbcli_concatenateImages -il band_red.tif band_green.tif band_blue.tif -out rgb.tif uint16

      where
      band_red.tif, band_green.tif, and band_blue.tif are the input files in the correct order,
      rgb.tif is the output RGB composite file
      uint16 is the output file datatype. By default it is float32 but that is too much. 
    3. Run the command.

      Processing messages appear. The bands are merged into the output file rgb.tif.
    4. Optional. Display the resultant file in a suitable viewer.

    Similarly, to combine the separate grayscale bands into a composite Colored Infra-Red CIR file, the following steps can be done.

    1. Open up a OSGeo4W Command Prompt.
    2. Type in the otbcli_concatenateImages command.

      C:\> otbcli_concatenateImages -il band_nir.tif band_red.tif band_green.tif -out cir.tif uint16
      Where
      band_nir.tif, band_red.tif, and band_green.tif are the ordered input bands
      cir.tif is the output file name
      uint16 is the output file data type
    3. Run the command.

      Processing messages appear. The bands are merged into the output file cir.tif.
    4. Optional. Display the resultant file in a suitable viewer.


    Wednesday, June 28, 2017

    Mask a LAS file using PDAL and QGIS

    The Point Data Abstraction Library (PDAL) comes with a useful function to mask or crop out a LiDAR LAS file with one or more polygons. The example screenshot below shows a point cloud overlaid with a red polygon in the upper right corner, which outlines the desired area of the point cloud to be cropped.

    The cropping can be done using PDAL's crop filter but it requires the cropping polygon to be specified in the Well Known Text (WKT) string format. This is a bit of pain but can be overcome using a few methods, one of which is shown below using QGIS and the Plain Geometry Editor plugin.

    Define the cropping polygon
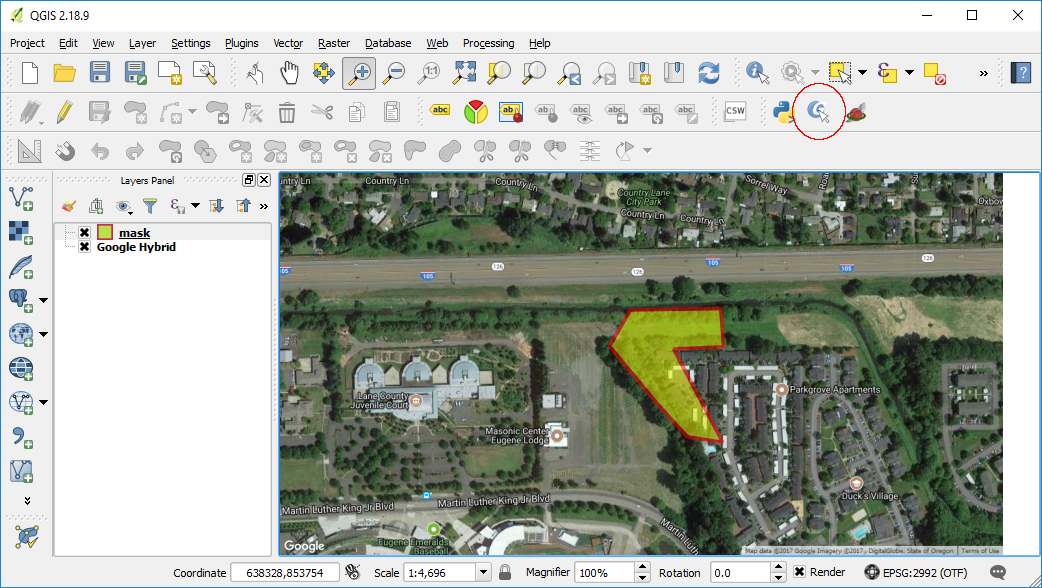
    1. In QGIS, draw a new polygon e.g. mask, as shown below.


      Note: The mask should be created in the same coordinate system as the LAS file
    2. Click the Plain Geometry Editor icon in the toolbar (red circle above). Click on the clipping polygon.

      The Plain Geometry Editor dialog box appears.


      Note: Install the Plain Geometry Editor plugin if the icon is not available.
    3. In the text field, select and copy all the polygon WKT text string into the Windows clipboard.  
    Create a PDAL processing pipeline JSON file
    1. In a text editor, type in something similar to the example below.
    2. From the Windows Clipboard, paste the WKT string from the previous section to the "polygon" attribute and surround it with double quote '"' characters.
    3. Save the JSON file e.g. process.json.
    {
      "pipeline":[
        "autzen.laz",
        {
          "type":"filters.crop",
          "polygon": "Polygon ((638500.66904077248182148 853359.34703735215589404, 638869.71793351718224585 853365.15883093187585473, 638881.34152069012634456 853208.24040409235749394, 638677.92874516302254051 853199.52271371346432716, 638878.43562390014994889 852818.85023379256017506, 638733.14078423334285617 852842.09740813483949751, 638611.09311891463585198 852975.76866063219495118, 638416.39803376235067844 853211.14630088687408715, 638500.66904077248182148 853359.34703735215589404))"
        },
        {
          "type":"writers.las",
          "filename":"file-cropped.las"
        }
      ]
    }

    Note: 
    • The pipeline JSON file stores the processes to be done in sequence in an array bracketed by the '[' and ']' characters. 
    • autzen.laz is the input LAS file for this example
    • filters.crop is the process to apply using the "polygon" attribute.
    • file-cropped.las is the output LAS file. 


    Run the cropping process
    1. Open up the OSGeo4W Shell.
    2. At the prompt, type in the pdal pipeline command:

      C:\> pdal pipeline process.json -v 4
      Processing messages appear. The file is cropped.

    3. Optional. Using your preferred LAS Viewer, open up the resultant cropped LAS file.

      The cropped file showing only the cropped area is displayed.


    Monday, June 12, 2017

    Using PDAL to classify isolated LiDAR points as noise

    LiDAR data often contains noise and it is necessary to identify and/or remove them. An example of a LAS file containing noise in the form of low isolated points beneath the ground is shown in the screen shot below.

    Isolated points can be easily identified by using statistical filtering methods, which the PDAL open source software has.

    To filter out these points using PDAL, perform the following steps.

    1. Open up the OSGeo4W Shell.

      The OSGeo4W Shell prompt appears.
    2. In the prompt, type in the command:

      C:\> pdal translate -i in_noisy.las -o out_filtered.las outlier --filters.outlier.method="statistical" --filters.outlier.mean_k=8 --filters.outlier.multiplier=3.0 -v 4

      Note:
      -i in_noisy.las is the input LAS file
      -o out_filtered.las specifies the output LAS file
      outlier tells PDAL to apply the outlier filter
      --filters.outlier.**** options specify the various outlier parameters
      -v 4 indicates the processing messages verbosity level


    3. After running the command, the isolated points are classified as Class 7 - Low Noise points in the output LAS file.

      The point cloud colored by classification.


      The resultant LAS file colored by elevation and with the class 7 - Low noise points turned off.

    Monday, May 29, 2017

    Simple LiDAR ground points classification and segmentation using PDAL

    PDAL (Point Data Abstraction Library) comes with a couple of options to segment point clouds by classifying LiDAR ground points (an example unclassified point cloud is shown below) - Simple Morphological Filter (SMRF) or Progressive Morphological Filter (PMF).

    I have found the SMRF method to be fast and produce reasonable results while the PMF method seems to take a much longer time to do the job. The steps to run ground classification on a LAS file are describe below.

    1. In Windows, open up the OSGeo4W Shell.

      The OSGeo4W Shell is displayed.
    2. In the OSGeo4W prompt, type in and run the command:

      C:\> pdal translate -i unclassified.las -o ground.las smrf -v 4

      Notes:
      -i unclassified.las is the input file
      -o ground.las specifies the output file
      smrf is the option to apply the Simple Morphological Filter
      -v 4 is the processing messages verbosity level


      Processing messages appear.
    3. Display the ground classified LAS file in a viewer.


    4. To use the Progressive Morphological Filter to perform the ground classification, type in the following command:

      C:\> pdal translate -i unclassified.las -o ground.las pmf -v 4

      Notes:
      -i unclassified.las is the input file
      -o ground.las specifies the output file
      pmf is the option to apply the Progressive Morphological Filter
      -v 4 is the processing messages verbosity level