Oracle has been building spatial query tools inside the database engine for many years now since Oracle 8i. But I have not seen many examples of Microsoft Office applications that directly query a Oracle Spatial database for spatially related information without having to use any GIS vendors' software.
A simple example that came to my mind is an Office application that generates water usage demand reports by geographic regions. Here, I outline the steps I took to create a simple Excel VBA to query an Oracle Spatial database. The VBA will look for all point geometries INSIDE a polygon geometry to calculate the total demand by usage type and the results printed to an Excel sheet.
Create Sample Oracle DataFor my convenience, I used Intergraph's
GeoMedia Professional 6.1 to create a couple of Oracle tables CUSTDATA and DEMANDPOLYGON with GEOMETRY fields. However, you can use any tool of your choice to create the spatial tables. Even plain SQL statements through the Oracle SQL*PLUS prompt is fine.
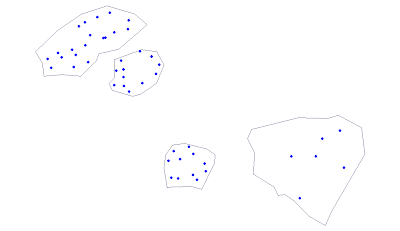
CREATE TABLE CUSTDATA( ID INTEGER, POSTCODE VARCHAR2(6), BPNAME VARCHAR2(255), TELNO VARCHAR2(10), ACCTCLASS VARCHAR2(255), PREMISENUM VARCHAR2(50), PREMISEADDR VARCHAR2(255), AVGBILL FLOAT(126), X FLOAT(126), Y FLOAT(126), GEOMETRY SDO_GEOMETRY);CREATE TABLE DEMANDPOLYGON( ID INTEGER, DESCRIPTION VARCHAR2(255), GEOMETRY SDO_GEOMETRY);CUSTDATA holds point geometry data while DEMANDPOLYGON stores polygon geometries. After creating the tables, I inserted a few records inside the newly created tables. My sample data looks like the screen shot below.
 Create an ODBC Data Source
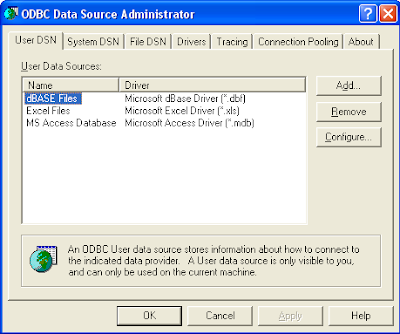
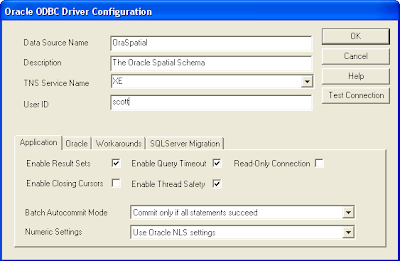
If you don't have an ODBC Data Source Name pointing to the Oracle schema, then you can use the Control Panel's
ODBC Data Source Administrator to define one as shown in the two figures below.
 Create a New VBA in Microsoft Excel
- Bring up Microsoft Excel and create a new Excel Workbook. Then click Tools > Macros > Visual Basic Editor to bring up the VBA Editor.
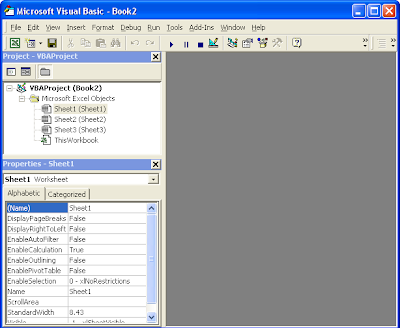
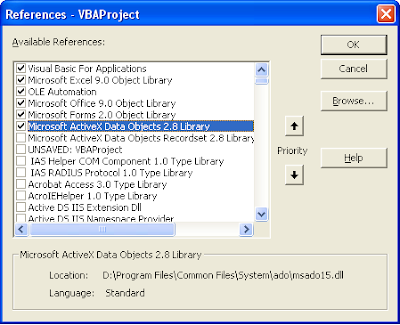
- Select Tools > References. Select Microsoft ActiveX Data Objects 2.1 library to reference.
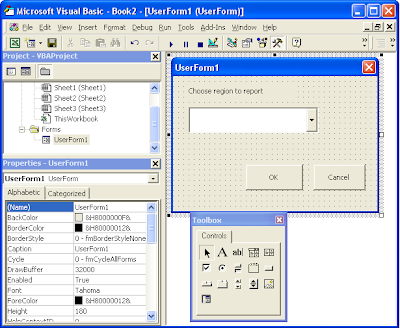
- Select Insert > UserForm to create a new form. By default, it is named as UserForm1.
- Using the IDE's toolbox, add in the following controls: Label, ComboBox, and 2 CommandButtons. Arrange the controls as shown in the figure below. Name the CommandButton controls as cmdOK and cmdCancel.
- Select View > Code to enter the VBA code for the UserForm1. Enter the following code.
Option Explicit
Dim mobjConnection As ADODB.Connection
Private Sub cmdOK_Click()
Dim sql As String
Dim objRs As ADODB.Recordset
Dim demandType As String
Dim demand As Double
Dim excelRow As Integer
'Form the Oracle Spatial query statement
sql = "SELECT A.ACCTCLASS,SUM(A.AVGBILL) AS DEMAND FROM CUSTDATA A, DEMANDPOLYGON B "
sql = sql & "WHERE "
sql = sql & "B.DESCRIPTION='" & ComboBox1.Text & "' "
sql = sql & "AND "
sql = sql & "SDO_RELATE(A.GEOMETRY,B.GEOMETRY,'MASK=INSIDE')='TRUE' "
sql = sql & "GROUP BY A.ACCTCLASS "
sql = sql & "ORDER BY A.ACCTCLASS ASC "
'Print out the report title and heading on the Excel sheet
With Sheet1
.Range("A1").Value = "REPORT OF WATER DEMAND FOR " & ComboBox1.Text
.Range("A2").Value = "TYPE"
.Range("B2").Value = "TOTAL DEMAND"
End With
'Submit the query to Oracle and loop through the recordset.
'Print out the results in the Excel sheet
excelRow = 3
Set objRs = New ADODB.Recordset
objRs.Open sql, mobjConnection
While Not objRs.EOF
demandType = objRs.Fields(0)
demand = objRs.Fields(1)
Sheet1.Range("A" & excelRow).Value = demandType
Sheet1.Range("B" & excelRow).Value = demand
excelRow = excelRow + 1
objRs.MoveNext
Wend
End Sub
Private Sub UserForm_Initialize()
Dim username As String
Dim password As String
Dim dataSourceName As String
Dim connString As String
username = "demo"
password = "demo"
dataSourceName = "demo"
' Open a ADO database connection to the Oracle Spatial Schema
connString = "Data Source=" & dataSourceName & ";User ID=" & username & ";Password=" & password & ";"
Set mobjConnection = New ADODB.Connection
With mobjConnection
.ConnectionString = connString
.ConnectionTimeout = 10
.CursorLocation = adUseClient
.Open
End With
'Query the DEMANDPOLYGON table for the names of all the polygons
'Add the names to the combo box for selection
Dim sql As String
Dim objRs As ADODB.Recordset
sql = "SELECT DISTINCT DESCRIPTION FROM DEMANDPOLYGON ORDER BY DESCRIPTION ASC"
Set objRs = New ADODB.Recordset
objRs.Open sql, mobjConnection
ComboBox1.Clear
While Not objRs.EOF
ComboBox1.AddItem objRs.Fields(0)
objRs.MoveNext
Wend
ComboBox1.ListIndex = 0
objRs.Close
Set objRs = Nothing
End Sub
- In the VBA IDE' project pane, right click on the ThisWorkbook object and select View Code. Add in the following code.
Private Sub Workbook_Open()
UserForm1.Show
End Sub
- Now save and close everything.
Running the Excel VBADouble click the Excel file you created previously. The Excel Workbook should open and you would be prompted with the following:
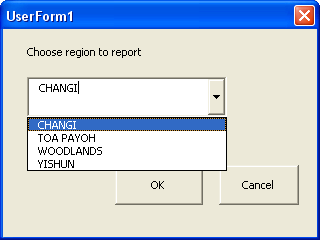
Choose a region from the drop down list and press
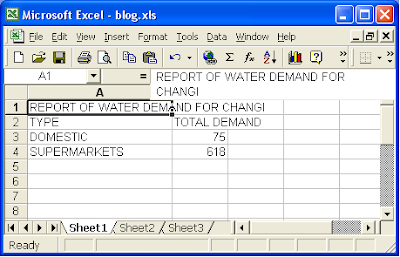
OK. The Excel VBA would submit a spatial query to Oracle to find all the CUSTDATA records inside the selected demand polygon. The results are grouped, tabulated and displayed in the Excel spreadsheet as shown below.
 Notes
NotesThe example code shown is quite unsophisticated. I have hardcoded the Oracle login, password and ODBC data source name. There is also no error handling at all. These are intentional as the example is just meant to illustrate a technique.


