Showing posts with label point cloud. Show all posts

Monday, October 26, 2020

Using CloudCompare to determine a 3D rotation matrix's euler angles and vice versa

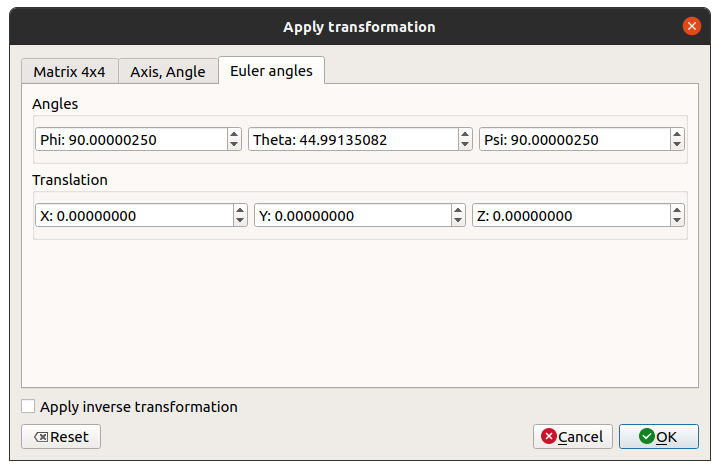
Working with 3D transformation matrices and Euler angles can be a little confusing with all that complex mathematical calculations. I found the Apply Transformation tool in CloudCompare to be useful in helping to calculate the Euler angles i.e. roll, pitch, and yaw given the transformation matrix, or vice versa. 

To use the tool the find the roll, pitch and yaw, you can do the following:

  1. Start up CloudCompare. Load a point cloud file and select it in the tree pane.


  2. Next, select Edit > Apply transformation.

    The Apply transformation dialog box appears.


  3. Type in the transformation matrix you want to determine the Euler angles.


  4. Then click the Euler angles tab.

    The calculated angles are displayed as Phi (yaw), Theta (pitch) and Psi(roll).

To determine the transformation matrix from the Euler angles, just type in the yaw, pitch, and roll values in the Phi, Theta and Psi fields. Then click the Matrix 4x4 tab. 

Monday, September 2, 2019

Resolving VeloView not displaying live sensor data from Velodyne Lidar sensors

This is a fairly common problem when running VeloView with a real Velodyne Lidar sensor on Windows - even though the sensor e.g. VLP-16 or HDL-32 are powered on and connected to the host computer, no live point cloud data is displayed in VeloView. All you get is a blank screen as shown below.


The probable reason is that the Windows Defender firewall is set to block VeloView from accessing the ports used by the Velodyne sensors. Normally, Windows will prompt whether to allow the program to access the ports on the first startup of the program. If you click no to the prompt, then Windows will never ask again. To enable the ports for VeloView, you will have to manually open the ports. The steps are shown below.

  1. Click the Windows Start button. Start typing "firewall with advanced...".

    A list of matches appear.


  2. Click on Windows Defender Firewall with Advanced Security.

    The Windows Defender Firewall with Advanced Security dialog box appears.

  3. Click on Inbound Rules. Scroll the list and look for entries with the name Veloview.


  4. For each Veloview entry, double click on it.

    The Veloview Properties appear.

  5. Toggle on Enabled. Choose Allow the Connection. Click OK. Repeat for each Veloview entry.

    The entry in the list should be marked with a green tick icon.

  6. Close the dialog.

    VeloView should be able to display the live data from the Velodyne sensor.

Monday, July 8, 2019

Setup an Ubuntu VirtualBox instance on Windows 10 to connect to a Velodyne VLP-16 sensor

An Ubuntu 18.04 guest OS virtual machine running on a Windows 10 host can connect to a Velodyne VLP-16 LiDAR sensor and process the sensor's data and positioning packets. However, the VirtualBox Ubuntu guest OS must be configured properly to transfer the LiDAR data packets from the host OS to the guest OS. The following steps show how to perform the settings.
  1. On Windows, open the Internet and Network Settings.

     
  2.  Click the Change adapter options.

    The Network Connections window opens.
  3. Right click on the Local Area Connection icon. Choose Properties.

    The Local Area Connection Properties dialog box appears.
  4. Select Internet Protocol Version 4. Click Properties.

    The Internet Protocol Version 4 (TCP/IPV4) Properties appear.
  5. Toggle on Use the following IP address. In the IP address field, type in the following address:

    192.168.1.77
  6. Click OK to all the dialog boxes.

    The local Windows machine IP address is changed to 192.168.1.77


  7. Optional. If necessary, use the Windows Defender Firewall with Advanced Security App to open up the host Windows OS UDP ports for Oracle VirtualBox. In the Inbound Rules, make sure the VirtualBox Manager entries are enabled, as shown below.


  8. Now start Oracle VirtualBox.

    The Oracle VM VirtualBox Manager appears.
  9. Select the Ubuntu instance, e.g. Ubuntu18. Then click Settings.

    The Ubuntu18 Settings dialog box appears.
  10. Click Network. Then click the Port forwarding button.

    The Port forwarding rules dialog box appears.
  11. Click the Plus icon and add in two UDP protocol rules as shown below.


    Note: The rules will forward UDP packets from ports 2368 and 8308 on the Windows host to the same ports on the Ubuntu guest.
  12. Click OK.
  13. Now start the Ubuntu18 host.
  14. Login to Ubuntu and run Veloview. In Veloview, connect to the Velodyne VLP-16 sensor stream as per normal.

    The LiDAR point cloud is displayed.

Monday, June 3, 2019

Installing and running the Velodyne Height Map package on ROS Melodic distribution

The ROS Velodyne Height Map package (https://wiki.ros.org/velodyne_height_map) is a useful tool for identifying obstacles in a point cloud. An example of potential obstacles is shown below (the red squares).

However the last supported ROS distribution seems to be Indigo, a few releases from the latest Melodic distribution. But it is still possible to install and run the package on the latest ROS distribution. To do that, the source code from https://github.com/jack-oquin/velodyne_height_map must be downloaded and compiled on the ROS installation. The following steps illustrate the procedure.

Create a ROS Catkin workspace
  1. Follow the tutorial here at https://wiki.ros.org/catkin/Tutorials/create_a_workspace to create an empty workspace, e.g /path/to/catkin_ws/.
Download the Velodyne Height Map source code
  1. Open up a Terminal. Change the directory to the location of the Catkin workspace's src directory created earlier.

    $ cd /path/to/catkin_ws/src
  2.  Assuming git is installed, clone the velodyne height map source code.

    $ git clone https://github.com/jack-oquin/velodyne_height_map.git
Build the package
  1. In the Terminal, change the directory to the root of the Catkin workspace.

    $ cd /path/to/catkin_ws
  2. Type in the following command to build the packages.

    $ catkin_make
Once the package is built, the Velodyne Height Map package can be executed according to the instructions here at https://wiki.ros.org/velodyne_height_map. For example,

$ rosrun velodyne_height_map heightmap_node

Monday, May 27, 2019

Displaying Velodyne PCAP data in ROS' RViz

Pre-recorded data in PCAP format from Velodyne's LiDAR sensors such as the HDL-32E, VLP-16, etc. can be displayed in the RViz application software from the Robotic Operating System (ROS). The following steps show how:
  1. In Ubuntu, open up a Terminal. Change directory to the location of the PCAP file e.g. /path/to/download/HDL32-V2_Monterey_Highway.pcap.

    $ cd /path/to/download/
    $ roslaunch velodyne_pointcloud 32e_points.launch pcap:=$(pwd)/HDL32-V2_Monterey_Highway.pcap


    Note 1: 32e_points.launch is the sample launch file for HDL-32E sensors (change this for different sensors),
    $(pwd) is a macro that points to the current working directory, and
    pcap:= points to the input PCAP file name
    .

    Note 2: By default, the LiDAR points are published in the velodyne coordinate reference frame, i.e. the points are relative to the Velodyne sensor.
  2. Open up another Terminal. Startup RViz by entering the following commands.

    $ rosrun rviz rviz -f velodyne

    Note: the -f option tells RViz to use the velodyne coordinate transformation frame.

    The RViz application starts up.

  3. Click the Add button as shown above.

    The Choose visualization dialog box appears.

  4. Click By topic and choose the topic /velodyne_points/PointCloud2. click OK.

    The PCAP point cloud is displayed.


    Note: the HDL-32E sensor is mounted on top of the car so the road is below zero as shown below.


  5. To transform the PCAP data to the car (so called odom frame), we have to define the transformation parameters from the odom frame to the velodyne frame. For example, say the HDL-32E is 2 meters above the odom frame origin. Open another Terminal and type in the following command:

    $ rosrun tf static_transform_publisher 0 0 2 0 0 0 odom velodyne 100
    Note: 0 0 2 0 0 0 values are equal to dx, dy, dz, and yaw, pitch, roll (in rads),
    odom is the parent or from frame,
    velodyne is the child or to frame, and
    100 is the time interval for publishing the transformation in msec
    .
  6. In the Fixed frame field of the RViz application, change the value to odom.

    The point cloud is displayed in the odom frame as shown below.

Monday, April 8, 2019

Segment individual trees from TLS point clouds with 3DForest

Identifying individual trees from point clouds scanned using Terrestrial LiDAR System (TLS can be easily segmented using this freely downloable software 3DForest. For more information about 3DForest, visit http://www.3dforest.eu/.

Note: although 3DForest has its own ground classification filter, I found it better to perform the ground / non-ground classification using alternative software like PDAL.

To use 3DForest to segment individual trees, the following steps can be done:
  1. Start up 3DForest. Select Project | New Project to create a new project.

    The 3DForest application appears.
  2. In the menu, choose Project | Import | Import Terrain Cloud to load in a LAS file of only ground points.

  3. In the dialog box that pops up, choose a ground class only LAS file, e.g. sample_ground.las.

    The LAS file is converted into a PCD format file and displayed.
  4. Next, choose Project | Import Vegetation Cloud. Choose a non-ground class only LAS file, e.g. sample_vegetation.las.

    The non-ground class LAS file is converted into PCD format and displayed.
  5. In the menu, select Vegetation | Automatic Segmentation to run the individual tree segmentation algorithm.

    The Automatic Segmentation dialog box appears.

  6. In the Input Vegetation Cloud combo box, choose the newly loaded sample_vegetation LAS file.
  7. In the Input Terrain Cloud combo box, choose the loaded sample_ground LAS file.
  8. If necessary, change the parameters, e.g. Prefix of Clouds value from ID to TreeID. Click OK.

    The individual trees are segmented into individual point clouds.


  9. If required, select Project | Export | Export Clouds to export the segmented trees to text or PLY formatted files.

Monday, December 3, 2018

Use PDAL to export colored LAS file to Point Cloud XYZ format text file

PDAL can be used to export out a colored laser LAS file like the one in the screenshot below into a text file in Point Cloud XYZ format, which is just an ASCII text file with each point in a row of X, Y, Z, R, G, B values.

To use PDAL to perform the conversion, follow the following steps.
  1. In Windows, open up an OSGeo4W Shell.


  2. In the command prompt, change directory to the folder containing the LAS file e.g. D:\Temp\data\.

  3. Use a text editor to create a PDAL pipeline JSON file, e.g. las2xyz.json, with the following contents.

    {
      "pipeline":[
        {
          "type":"readers.las",
          "filename":"color.las"
        },
        {
          "type":"writers.text",
          "format":"csv",
          "order":"X,Y,Z,RED:0,GREEN:0,BLUE:0",
          "keep_unspecified":"false",
       "quote_header": "false",
       "delimiter": " ",
          "filename":"outputfile.xyz"
        }
      ]
    }
    

    where color.las is the name of the input LAS file
    and outputfile.xyz is obviously the name of the output XYZ file.
  4. In the command prompt, type in the following command to perform the conversion.

    D:\> pdal pipeline las2xyz.json
  5. Press Enter.

    The X, Y, Z, R, G, B values of the LAS file are exported out into the text Point Cloud XYZ file.

Monday, May 21, 2018

Perform a 2D geo-registration of a LiDAR LAS file to a GeoTiff image with Cloud Compare

Recently I received LiDAR LAS point clouds generated without using accurate GPS positioning. As a result, the data is not placed at the correct geographic location in the world. To rectify this, I used Cloud Compare to so-called geo-register the point clouds to the world using GeoTiff images as reference.

The following illustrates how it was done:

Load the GeoTiff image as reference
  1. Start Cloud Compare.


  2. Select File | Open.

    The Open file(s) dialog box appears.

  3. Browse and select the reference GeoTiff raster file, e.g. autzen.tif. Click Open.

    The Result type prompt appears.

  4. Click No to load as a texture map instead of converting to a point cloud.

    The Global shift/scale dialog box appears.

  5. Accept the defaults. Click Yes.

    The GeoTiff image is loaded.
Load the LAS file
  1. Select File | Open.


  2. Browse and choose the LAS file, e.g. autzen.las. Click Open.

    The Open LAS File dialog box appears.
  3. Click Apply.

    The Global shift/scale dialog box appears.

  4. Click Yes to accept the defaults.

    The LAS file is loaded.
 Setup the display
  1. In the vertical tool bar on the left, click the Set Current View Mode icon
    and choose Orthographic projection.

    Note: we do not want the perspective projection display to mislead us as to the location of the features
  2. Optional. Select Edit | Colors | Height Ramp. Click OK in the Gradient color dialog box to display the point cloud with a height color gradient for better visualization.


Perform the rectification
  1.  In the DB Tree pane, select the point cloud to rectify, e.g. autzen.las.
  2. In the top tool bar, click the Translate/Rotate icon .

    The Translate/Rotate widget appears in the top right corner.
  3. In the Rotation field, select Z. Toggle off Tz.

    Note: we only want to move horizontally in the 2D plane.
  4. Look for matching features in the point cloud and the GeoTiff image.


  5. To translate the point cloud, press down the mouse right button and drag the point cloud to the new location. To rotate the point cloud, press down the mouse left button and rotate the point cloud.

    Note 1: To toggle the display of the point cloud, toggle on/off the Visible property in the Properties pane on the left.
    Note 2: To zoom in/out/pane around, pause the Translate/Rotate widget by clicking the widget's Pause icon.
  6. In the Translate/Rotate widget, click the Tick icon to save the changes.

    The point cloud is rectified.