Showing posts with label Google. Show all posts

Monday, April 21, 2014

A simple Chrome Web App for creating animated GIF files

Recently, it seems animated GIFs have been making a come back and used on social networks like Google+. I thought of making a simple Chrome Web App for creating the animated GIF files (using only Javascript, HTML5 and the gif.js library) without having to upload to a server for processing, i.e. the processing takes place within the web browser only. The resultant WebApp is available here on http://dominoc925-pages.appspot.com/webapp/gifanim/default.html.


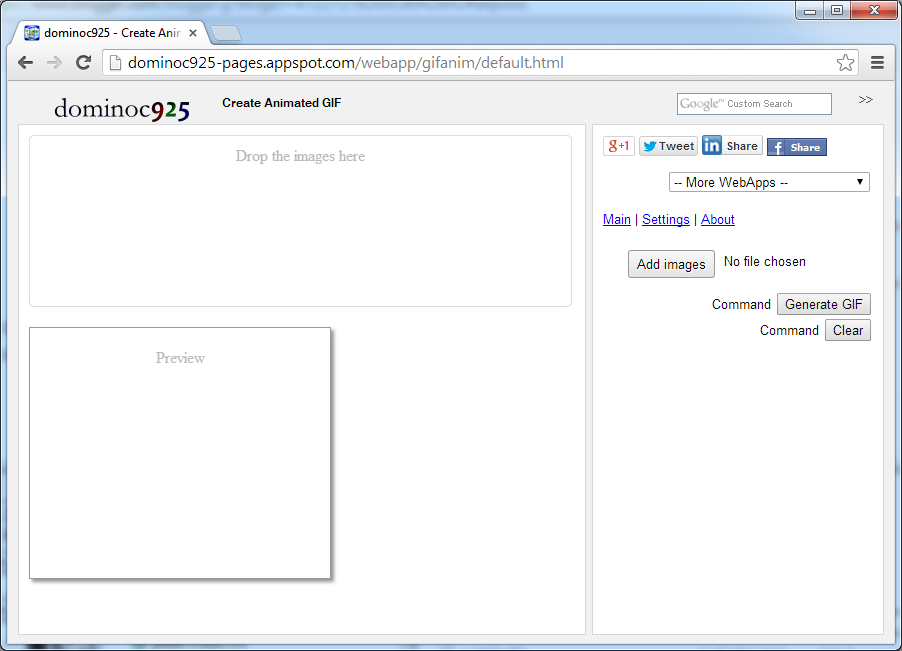
Using the WebApp is easy. The following steps show how to create an animated GIF with the default settings.

  1. Simply drag and drop the image frames into the box provided. Or click the Add Image button.

    The Open dialog box appears.

  2. Select one or more image files. Click Open.

    The thumbnails of the selected files appear in the box.

  3. Click Generate GIF.

    The animated GIF file is created.

  4. To save the animated GIF file, mouse right click on the animation. Select Save Image As.


    The Save As dialog appears.
  5. Type in a file name. Click Save.

    The animated GIF file is saved.
Delete or change the order of the image frames
  1. If you want to change the order of the images, simply click on the image thumbnail.

    The Move previous, delete, and Move next icons appear below the thumbnail.

  2. Click Move previous to move the selected image before the previous image frame.
  3. Click Move next to move the selected image after the next image frame.
  4. Click Delete to delete the selected image.
Changing the default settings
  1. If you want to change the default settings, click on Settings on the right pane.


  2. In the Quality field, choose another value.
  3. In the Animation speed field, choose another value.
  4. In the Repeat field, choose another value.
  5. In the Canvas size field, choose another value.
  6. Click Generate GIF to see the effects. 

Monday, July 8, 2013

Google Gadget for monitoring 911 incident calls in Portland, Oregon

This gadget allows users to monitor the City of Portland, Oregon's Police 911 Dispatch Incidents on a Google Maps backdrop by subscribing to the geoRSS feed of the 100 most recent, closed, non-confidential calls for service received by the City of Portland's 911 system. 

The incidents are shown as clickable and color coded icons with tool tips. Incidents that happened an hour or less ago will be fully opaque; at more than an hour but less than three hours, the icons will be displayed at 50% opacity; at greater than three hours, the icons will be shown at 25% opacity. 

Leave the gadget on the screen and it will update itself every few minutes with the latest information. Clicking on the icon will bring up more details about the incident. Together with Google Street View, users can truly immerse themselves into the incident environment

Monday, June 24, 2013

Create bar charts on Google Maps

This Mapplet was developed to create bar charts (vertical or horizontal) on Google Maps from text files formatted as comma separated values (CSV). An example screenshot of vertical bar charts is shown below. 


Creating the bar charts is simple as shown below:

  1. Run the Mapplet by opening this link http://dominoc925-pages.appspot.com/mapplets/map_barcharts.html from any modern browser.
  2. Click Import CSV.

    The Import Comma Separated Values (CSV) File dialog appears.

    NoteThe CSV data must have a header row, geographic latitude and longitude columns to point to the locations to place the charts on.
  3. Click Choose File. Browse and select a CSV file. Alternatively, copy and paste the contents of a CSV file into the text box.

    The CSV data is loaded into the text box. The color scheme combo boxes for each CSV data column appear.

  4. If necessary, choose the correct CSV Delimiter, Latitude Column, and Longitude Column from the combo boxes.
  5. From the Chart Orientation field, choose either Vertical or Horizontal.
  6. Optional. Choose the chart size in pixels.
  7. In the Color scheme combo boxes, choose the colors to represent the CSV data columns.
  8. Click Create Charts.

    The horizontal bar charts are created.

  9.  The charts created can be clicked on to show the values. The charts can also be dragged and moved to a different location on the map if necessary.

Monday, May 20, 2013

Android App for monitoring natural disasters

You can monitor natural disasters around the world, as published by the Global Disaster Alert and Coordination System - www.gdacs.org with this Android App. The app shows the latest natural disasters like earthquakes, volcano eruptions, tropical cyclones, tsunamis and floods as color coded icons in a list as well as on a Google Maps backdrop; the icon colors indicate the alert level - green, orange, and red. The icon will look more transparent the older the event was published. 

The list view can be used to sort the natural disaster events according to the date time, region, and disaster type. 

Clicking on an item on the list will bring up more details about the disaster event.

To view more information about the event, clicking the Browser button will open up the source GDACS web page with more details, as shown below.

On the other hand, clicking the Map button will bring up a Google Map view of the event, as shown below.


Download the app from the Google Play store. 
Get it on Google Play

Monday, February 11, 2013

Example KML for displaying a photo image from the local disk

Recently I had to generate some Google Earth KML files for displaying photos from a local hard drive in a Placemark balloon. In order to display local images not from a web server, the file keyword must be used with 3 forward slashes in the HTML img tag followed by the full path of the photo file, as shown in the example KML code below.

 <?xml version="1.0" encoding="utf-8"?>  
 <kml>  
  <Document>  
   <name>Example of displaying a local image file</name>  
   <Placemark>  
    <name>Monaco</name>  
    <Snippet>Photo 1</Snippet>  
    <description><![CDATA[  
 <img src='file:///c:\temp\monaco\IMG_5523.jpg' width='400' /><br/&gt;  
 Photo taken from near the palace in Monaco<br/>  
 ]]>  
 </description>  
    <Point>  
     <coordinates>7.421630,43.731459</coordinates>  
    </Point>  
   </Placemark>  
  </Document>  
 </kml>  
The following screenshots show how this KML file is rendered in Google Earth.
 When the Placemark is clicked, the balloon pops up showing the local photo image file.

Monday, January 21, 2013

How to change between satellite and traffic layers in Google Maps on Android

I wanted to open up a dialog box from the Google Maps View to toggle between the satellite and traffic map layers as shown in the screenshot below.

I used the code snippet below to toggle between the map layers. But it could not toggle between the layers.
 @Override  
 public void onClick(DialogInterface dialog, int which) {  
 // TODO Auto-generated method stub  
 String layer = (String) layers[which];  
 if (layer.compareToIgnoreCase("traffic")==0){  
 _mapView.setTraffic(true);  
 _mapView.invalidate();  
 }  
 else if (layer.compareToIgnoreCase("satellite")==0) {   
 _mapView.setSatellite(true);  
 _mapView.invalidate();  
 }  
 dialog.dismiss();  
 }  

Later, I found out I could resolve the problem by setting the previous layer to false as shown in the snippet below.

 @Override  
 public void onClick(DialogInterface dialog, int which) {  
 // TODO Auto-generated method stub  
 String layer = (String) layers[which];  
 if (layer.compareToIgnoreCase("traffic")==0){  
 _mapView.setSatellite(false);  
 _mapView.setTraffic(true);  
 _mapView.invalidate();  
 }  
 else if (layer.compareToIgnoreCase("satellite")==0) {  
 _mapView.setTraffic(false);  
 _mapView.setSatellite(true);  
 _mapView.invalidate();  
 }  
 dialog.dismiss();  
 }  

Monday, January 14, 2013

Stop the ListView from turning black while scrolling in Android

While developing an Android app, I noticed that my nice white color ListView will turn black whenever I scroll the list. See the screenshot below.


I found out that I set the cacheColorHint property to black in the Android layout xml file.
    <ListView
        android:layout_width="match_parent"
        android:layout_height="match_parent"
        android:id="@+id/listView1"
        android:background="#ffffff"
        android:cacheColorHint="#000000" >
    </ListView>

To rectify the problem, simply set the cacheColorHint property to white to match the background color as shown below.
    <ListView
        android:layout_width="match_parent"
        android:layout_height="match_parent"
        android:id="@+id/listView1"
        android:background="#ffffff"
        android:cacheColorHint="#FFFFFF" >
    </ListView>
Alternatively instead of white, it is okay to set the CacheColorHint property to transparent.

    <ListView
        android:layout_width="match_parent"
        android:layout_height="match_parent"
        android:id="@+id/listView1"
        android:background="#ffffff"
        android:cacheColorHint="@android:color/transparent" >
    </ListView>


And the resultant scrolling of the list will work correctly, as shown below.

Monday, January 7, 2013

Earthquake Monitor Web App

Since Google has announced that it will be closing down the iGoogle site, I decided to migrate some of the Google Gadgets that I had written to Chrome Web Apps for the Chrome Web Store. I consolidated the various earthquake gadgets using the USGS, British Geological Survey, Euro-Mediterranean Seismic Monitoring Center, and the New Zealand GeoNet earthquake feeds into a single Web App.

The screenshot below shows the Earthquake Monitor Web App. It can be installed through the Chrome Web Store (search for Earthquake Monitor) or directly from this url address http://dominoc925-pages.appspot.com/webapp/quakemon/default.html.


Simply choose an earthquake source feed in the side bar's Earthquake feed combo box as shown below.

The earthquake epicenters will be displayed as color coded icons by depth and time on Google Maps. Hovering the cursor on the icons will display a tool tip showing summary details about the earthquake event. Clicking on the icon will open up a page showing more detailed information.


Clicking on the List link in the side bar will display a list view of the earthquake events. The list can be sorted according to the time, depth or magnitude of the earthquake event. Clicking on the Map link will center and zoom to the earthquake epicenter in Google Maps.


Monday, December 31, 2012

Display Shapefiles on Google Maps with this Google Mapplet

It would be nice to import and overlay ESRI Shapefiles over a Google Maps backdrop without having to upload the files to a web server. With the new HTML5 FileReader objects  implemented in modern browsers, it is now possible to do this. I burnt some midnight oil to write this tool to read, reproject to the Mercator coordinate system, and display Shapefiles as Google Maps overlays.

The following steps demonstrate how to use the tool.

  1. Use a modern browser (such as Chrome or FireFox) to open this page http://dominoc925-pages.appspot.com/mapplets/vshpfile.html.


  2. Click Import shapefile.

    The Import Shapefile dialog box appears.
  3. In the SHP field, click the Choose File button. Browse and select a Shapefile e.g. mgrs6x8_east.shp.


  4. In the DBF field, click the Choose File button. Browse and select the Shapefile's corresponding DBF file e.g. mgrs6x8_east.dbf.


  5. In the Coordinate system type field, choose the correct system for the Shapefile e.g. Geographic. If Projected is chosen, then choose the correct Projection.


  6. In the Geodetic Datum field, choose the correct datum e.g. WGS84.
  7. Click Start Import.

    If all goes well, the Shapefile will be displayed on the Google Maps backdrop. It might be necessary to zoom into the Shapefile's bounds by clicking the More commands | Fit shapefile buttons on the sidebar.


  8. Click on the Shapefile overlay to display the DBF attributes in an Info window.


  9. Repeat to display more Shapefiles. 

Monday, August 6, 2012

Google Mapplet to show geo-referenced image overlays

In standard desktop GIS software applications, it is a common task to display geo-referenced images. I wanted to be able to do the same using just a modern browser and an Internet connection. So after a few late nights, I completed writing this Google Mapplet to load and display local image files with associated ESRI world files as custom overlays in Google Maps. I had to use the HTML5 FileReader objects so only modern browsers such as Chrome, FireFox, Internet Explorer 10 will work.

  1. To run the mapplet, simply go to the site http://dominoc925-pages.appspot.com/mapplets/geoimage.html.

  2. In the sidebar, click the Import Images button.

    The Import image dialog box appears.

  3. In the Image file field, click the button. Browse and select an image file e.g. C44122a1geo.jpg.
  4. In the World file field, click the button. Browse and select the corresponding ESRI world file e.g. C44122a1geo.jgw.
  5. If the image file is in the non-projected coordinate system, then choose Geographic in the Coordinate system type combo box. If the image file is in a projected coordinated system, then choose Projected.

    Note: the raster image transformation for projected coordinate system to the Google Maps Mercator coordinate system is not very accurate. The positioning would be more accurate if the raster image were already in non-projected or Mercator coordinate system.
  6. If the image file is in a projected coordinate system, then choose the correct projection in the Projection combo box.
  7. In the Geodetic Datum field, choose the horizontal datum of the image file, e.g. WGS84, Global Definition.


  8. Click Start Import.

    The image is loaded and displayed.

    If necessary, click the Fit image or Fit all images buttons in the sidebar to center the map display on the image(s)
    .

  9. Optional. If you want to load more images, then repeat the previous steps 3 to 8.
  10. Click Close.

Monday, July 9, 2012

Create geo-referenced heat maps Google Mapplet

Comma-separated-values (CSV) of statistical data in the format latitude, longitude, and magnitude can be imported and visualized as heat maps in Google Maps using this custom mapplet. An example screenshot is shown below.


While the heat maps feature is already possible using the Google Docs FusionTable object, the heat maps created from this Mapplet is done using the HTML5 canvas object via the Javascript heatmap.js library. On  top of that, the Mapplet provides the option to export out the heat map image file along with supporting geo-referenced information in the form of world and projection files.

To run the Mapplet, click this link http://dominoc925-pages.appspot.com/mapplets/vheatmap.html.

The Mapplet's sidebar contains a few button commands that should be obvious - Import, Export, Fit and Clear.


Clicking the Import button brings up the Import Points dialog. 

Copy and paste your comma-separated-values data into the text box. The data must be comma delimited and in  the following order: latitude, longitude, and magnitude. Alternatively, click Use random samples to let the Mapplet randomly create CSV data for demonstration purposes. 

Then click Start Import to create the heat map. 

Click  the Export button to export the heat map and supporting files. This will bring up the Export Heatmap dialog box. 

To save out the heat map image, right click on the image preview and choose Save image as

Next, click on the World file text box and press +C to copy the contents to the clipboard. Then paste inside a text editor and save the world file with the same file name but with the prefix *.pgw. 

Similarly, click on the Projection text box and press +C. Then paste in a text editor and save the contents into a projection file with the same file name prefix but with the extension *.prj. 


Once the image, world file and projection have been exported, the heat map can be displayed and overlaid with other geo-spatial data in any GIS software e.g. Global Mapper as shown below.