
About Geospatial Applications, FME, Visual Studio, gvSIG, Global Mapper, Programming, LiDAR, GIS, Google Maps, SAGA GIS, Android, QGIS
Monday, June 14, 2010
Google Gadget for showing UTM Grid Zones of the world
The Universal Transverse Mercator (UTM) coordinate system is a grid-based system for specifying locations on the earth's surface. UTM consists of 60 zones, each with its own local Transverse Mercator projection. This gadget will allow you to display UTM grid zones of the world with labels on Google Maps.


Monday, June 7, 2010
Creating buffers in Global Mapper
Buffer zones can be easily created in Global Mapper. The buffers can be merged and/or zoned depending on the parameters you choose during the creation.
The following steps can be used to create buffers using Global Mapper.
- Start up Global Mapper and open up a data file or create some line work to create buffers.
The figure below shows two line geometries.
- Press ALT+D to activate the Digitizer Tool. Drag a box to select the geometries for buffering.
The geometries are selected.

- Press a right click on the mouse.
A pop up menu appears.
- Choose Advanced Feature Creation Option | Create Buffers Around Selected Features.
The Setup Buffer Area Creation dialog box appears.
- In the Number of Buffer Zones for Each Feature field, type in a value e.g. 1.
- In the Buffer Distance field, type in a value e.g. 100,
- Toggle on or off Combine Overlapping Buffer Areas.
- Click OK.
The buffer(s) is created. By default the buffer(s) is created selected.


An uncombined single buffers are shown in the figure below.


Monday, May 31, 2010
Create range thematics with Global Mapper
It is not very obvious from the graphical user interface design and arrangement but it is quite possible to create thematic maps with Global Mapper; but the function is not as convenient as GeoMedia's or MapInfo's. I tried to use Global Mapper to create a similar range thematic map of average temperatures in the US as the sample GeoMedia dataset (shown below).

To create thematic maps in Global Mapper, do the following:

- Start up Global Mapper and display a polygon geometry data file e.g. States.shp.
- Press ALT+C.
The Overlay Control Center dialog box appears.
- Select the layer in the list box and click Options.
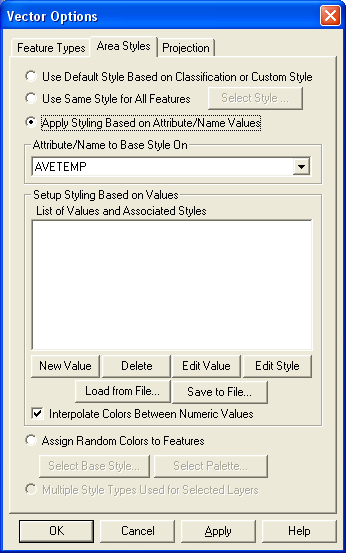
The Vector Options dialog box appears.
- Click the Area Styles tab.

- Toggle on Apply Styling Based on Attribute/Name Values.
The Attribute/Name to Base Style On drop down list is activated. - In the Attribute/Name to Base Style On field, choose a field e.g. AVETEMP.

Note: In this example, we want to create a range thematic map based on the average temperature values in Fahrenheit from 20 degrees to 100 degrees. Each range is 10 degrees e.g. 60 ~ 69.99. - Click New Value.
The Select Area Style dialog box appears.
- In the Fill Pattern field, choose a value e.g. Solid Fill. Click the Fill Pattern Color.
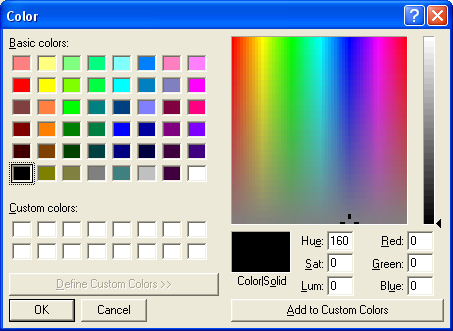
The Color dialog box appears.
- Choose a color. Click OK.
The Enter Value for Style dialog box appears.
- Enter the value e.g. 60. Click OK.
- Repeat the previous steps 7 to 10 to create the ending range value e.g. 69.99.
- Repeat the previous steps 7 to 11 to create the next starting and ending range values e.g. 70 to 79.99.
- Toggle Interpolate Colors Between Numeric Values on.
The Vector Options dialog box may look like this.
Note: It is much easier to define thematic ranges in GeoMedia as it has a function to automatically classify the ranges based on the actual attribute values. - Click OK.
The range thematic map is created. Compare this with the sample GeoMedia thematic map above.





Monday, May 24, 2010
GDM2000 - BRSO (GRS80) Coordinates Conversion Calculator

Note: A WebApp version of this Google Gadget is available here http://dominoc925-pages.appspot.com/webapp/gdm2000brso/default.html.
GDM2000 or Geodetic Datum of Malaysia 2000 and BRSO or Borneo Rectified Skew Orthomorphic are coordinate systems commonly used in East Malaysia. This Google Gadget will allow you to convert between one or more pairs of BRSO easting, northing coordinates and geographical GDM2000 latitude, longitude (GRS80) coordinates, all on GRS80 ellipsoid.

Monday, May 17, 2010
Using Excel to calculate the RMSE for LiDAR vertical ground control points
The height accuracy of the collected LiDAR data can be verified by comparing with independently surveyed ground control points on hard, flat, open surfaces. It is essentially just calculating the height differences for all the control points and then determining the height root mean squared error (RMSE) or differences. Most LiDAR processing software have the reporting function built-in. However, plain Microsoft Excel can also do the job (except for extracting the elevation from the LiDAR data.
Assuming that you are able to calculate the height differences for all the control points and place in a spreadsheet as shown in the figure below. I have a column of delta Z values in column A.

Then to calculate the RMS value for the elevation differences, I can do the following.
Assuming that you are able to calculate the height differences for all the control points and place in a spreadsheet as shown in the figure below. I have a column of delta Z values in column A.

Then to calculate the RMS value for the elevation differences, I can do the following.
- In a cell, type in the formula:
= SQRT(SUMSQ(A2:A18)/COUNTA(A2:A18))
where A2:A18 are the values from cell A2 to A18 in the spreadsheet. Simply replace these with the actual locations on your spreadsheet.
- Press RETURN.
The RMSE value is calculated.


Monday, May 10, 2010
GDM2000 - MRSO(Peninsular) on GRS80 Ellipsoid Coordinates Converter

Note: A WebApp version of this Google Gadget is available here http://dominoc925-pages.appspot.com/webapp/gdm2000mrso/default.html.
GDM2000 or Geodetic Datum of Malaysia 2000 and MRSO(Peninsular) or Malayan Rectified Skew Orthomorphic are coordinate systems commonly used in Peninsular or West Malaysia. Thie Google Gadget will allow you to convert between one or more pairs of MRSO(Peninsular) easting, northing coordinates and geographical GDM2000 latitude, longitude (GRS80) coordinates, all on GRS80 ellipsoid.

Friday, April 30, 2010
Google Gadget for creating charts on Singapore's OneMap
The Singapore Land Authority (SLA) launched an alternative to Google Maps recently - called OneMap. It's built on ESRI's ArcGIS server and it comes with its OneMap Javascript API, which is essentially a wrapper around ESRI's API. This gives me a chance to work with ESRI's Javascript API and I decided to port the Charting Google Mapplet I wrote earlier to OneMap. The figure below is a screen shot of the gadget running in iGoogle's expanded Canvas mode.
 This gadget will create pie charts on Singapore's OneMap from text files formatted as comma separated values (CSV). The CSV data must have a header row, SVY21 easting and northing columns to point to the locations to place the charts on. The charts created can be clicked on to show the values.
For IE8 users, please run in IE7 or IE8 compatibility mode as IE8 breaks OneMap.The figure below shows the problem of OneMap with Internet Explorer 8 on iGoogle. I am not able to determine the source of the problem but you can click IE's Page button and choose Compatibility View Settings to turn add google.com to the Compatibility View websties .

To run this gadget, click this link http://www.google.com/ig/adde?moduleurl=http://dominoc925-pages.appspot.com/gadgets/chart_onemap_ig.xml&source=imag.

For IE8 users, please run in IE7 or IE8 compatibility mode as IE8 breaks OneMap.The figure below shows the problem of OneMap with Internet Explorer 8 on iGoogle. I am not able to determine the source of the problem but you can click IE's Page button and choose Compatibility View Settings to turn add google.com to the Compatibility View websties .

To run this gadget, click this link http://www.google.com/ig/adde?moduleurl=http://dominoc925-pages.appspot.com/gadgets/chart_onemap_ig.xml&source=imag.
Subscribe to:
Posts (Atom)
