Monday, July 25, 2011

Simple gvSIG Jython Console script to list layers in a Map View

I have always wondered how to use the Jython Console in gvSIG. There isn't much published documentation on using it or perhaps I simply were not very good in finding it. In any case, I managed to figure out how to access and use the gvSIG objects from within the Console window. To illustrate, I wrote a simple Python script that simply gets a pointer to the active Map View window and then loop through the list of loaded layers and print out the name and number of records for each layer.

Below is the example code listing and saved to a script file test.py.


#import gvSIG library
from gvsiglib import *

#get the map view
mapview = gvSIG.getActiveDocument()
#get the map control
mapctrl = mapview.getMapControl()
#get the map context
mapctx = mapctrl.getMapContext()

#print the list of layers in the map view and the record count for each layer
for i in range(mapctx.getLayers().getLayersCount()):
    layer = mapctx.getLayers().getLayer(i)
    rs = layer.getRecordset()
    print "%s,%d records" % (layer.getName(), rs.getRowCount())

  1. Start up gvSIG OADE 2010. Open a Map View. Load in a couple of layers e.g. BLDG.shp and layer1.shp.


  2. Select File | Scripting | Jython Console.

    The Jython window appears.

  3. At the Jython prompt, type in: execfile ("c:/temp/test.py").

    The script is loaded and executed listing out the layers and the number of records.
Instead of loading from a script file, the Jython Console can accept typing in the code line by line in the Console prompt. However, I find using a script file is more convenient. 

After the gvsiglib has been imported into the Console, it is possible to access the gvSIG objects and make use of the auto-completion capabilities of the Jython Console to explore the object methods and properties as shown in the screen shot below.

Monday, July 18, 2011

Google Gadget for monitoring UK earthquakes


This gadget will allow you to subscribe to the British Geological Survey (BGS)'s recent UK earthquake GeoRSS feed. It shows the latest earthquakes as color coded (by depth and age) icons with tool tips on a Google Maps backdrop - the older the earthquake, the more transparent the icon will look.

The gadget has a list tab which displays the earthquake information as a text list with hyperlinks for more details - the list can be sorted by the earthquake magnitude, depth as well as the date-time. Using the list, you can easily find and locate the largest, the latest or the deepest earthquakes.

You can leave this gadget on the screen and it will update itself as it receives the latest feed. Upon receiving the data, it will automatically zoom to the latest earthquake epicenter. Clicking on an earthquake icon will bring up more information about the earthquake from the BGS site.

Monday, July 11, 2011

Connecting GeoMedia Professional to a read/write PostGIS database warehouse

Intergraph has released an open source GeoMedia PostGIS data server under the Apache 2.0 license on this site http://geomediapostgis.codeplex.com/. I downloaded and tried out creating and connecting to a read/write PostGIS warehouse on a Windows server from a remote client using the sample GeoMedia workspace USSampleData.gws. The instructions on the binaries talked about using Debian Linux as the host for the PostGIS database while I used Windows XP as the host instead.

Installing PostGIS 1.5 onto PostgreSQL 9.0 on Windows
After installing PostgreSQL 9.0 on Windows using the packaged installer on my server, I did the following:
  1. Download the PostGIS 1.5 Windows binaries from http://postgis.refractions.net/download/windows/pg90/postgis-pg90-binaries-1.5.3.zip
  2. Extract the files into a folder e.g. C:\Program Files\postgis-pg90-binaries-1.5.3.

  3. Use a text editor and open up the makepostgisdb.bat file.

  4. If necessary, change the PGPORT, PGHOST, PGUSER, and PGPASSWORD settings to match the Windows PostgreSQL installation.
  5. Uncomment the last line to create the database defined by the THEDB setting as a template PostGIS database e.g template_postgis15. Close and save the file.

  6. Run the batch file makepostgisdb.bat.

    PostGIS is installed and a template database is created.
Configure PostgreSQL for network access
By default, PostgreSQL is configured not to accept any network database requests. I had to do edit the configuration parameters to allow network access.
  1. On the server, select Start | All Programs | PostgreSQL 9.0 | pgAdmin III.

    The pgAdmin III application appears.
  2. In the Object browser pane, double click on the PostgreSQL 9.0 (localhost:5432) node. Enter the password if prompted.

    Connection to the server is established.
  3. Select Tools | Server Configuration | pg_hba.conf.

    The Backend Access Configuration Editor appears.
  4. Double click the empty last row.

    The Client Access Configuration dialog appears.
  5. Toggle Enabled on. Choose host for Type, all for Database, all for User and md5 for Method. Type in an appropriate IP Address for your network e.g. 192.168.8.0/24.

    Note: In this example, I am allowing access for any clients with the IP address pattern 192.168.8.*.
  6. Click OK.
  7. Select File | Save. Press Yes if prompted.
  8. Select File | Reload Server. Press Yes if prompted.
  9. Close the Client Access Configuration and Backend Access Configuration dialogs. 
Create and configure the Postgis database
  1. In the Object browser, expand and select Login Roles node.
  2. Select Edit | New Object | New Login Role.

    The New Login Role dialog box appears.
  3. In the Role Name field, type in gdouser. In the Password and Password(again) fields, type in gdouser.

  4. Click OK.

    The login is created.
  5. In the Object browser, select the Database(s) node.
  6. Select Edit | New Object | New Database.

    The New Database dialog box appears.
  7. In the Name field, type in gdotest. Choose gdouser as the Owner. Choose template_postgis15 as the Template.

  8. Click OK.

    The database is created.
Configuring the PostGIS GDO server on the client
  1. On the client machine, I downloaded the PostGISGDObin.zip package from http://geomediapostgis.codeplex.com and extracted to a folder e.g. C:\Program Files\PostGISGDO\.

  2. Run Register.bat.

    The data server is registered with GeoMedia.
  3. Double click the file PsgDBUtils.exe.

    The PostGIS GDO Database Utilities appear.
  4. Click New Connection.

    The New Connection dialog box appears.

  5. In the Server field, type in the address or name. In the Database field, type in gdotest. In the User field, type in gdouser. In the Password field, type in gdouser. Click OK.

    The utility is connected to the PostGIS database.
  6. Click Create INGR Metadata Tables.

    The metadata tables are created.
  7. Click Run script.

    The Open dialog box appears.
  8. Browse and choose the file USSampleProjCS.sql. Click Open. Click OK when prompted.

    Note: this script will add the Albers Equal Area coordinate system to the PostGIS database for working with the sample USSampleData.gws workspace.
  9. Click Close.
Connect to the PostGIS database from GeoMedia
  1. Start GeoMedia and open up the sample workspace USSampleData.gws.
  2. Select Warehouses | New Connection.

    The New Connection dialog box appears.
  3. Choose PostGIS Connection Type.
  4. In the Server field, type in the IP address or node name of the PostGIS server.
  5. In the Database field, type in gdotest.

  6. In the User and Password fields, type in gdouser. Click OK.

    GeoMedia is connected to the PostGIS database.

    Note: You should now have full read/write access to the PostGIS database.

Monday, July 4, 2011

Convert raster to vector polygons with Global Mapper

Global Mapper 12 has a function tuck away in a pop up menu to convert a grid layer or image layer into vector polygon features. It's the Create Area Features from Equal Values in Selected Layer accessible from the Overlay Control Center's right click pop up menu. Using this function is straightforward - simply load in a grid layer, fill in some parameters, and run the command.

To show how this works, see the example below in which a forest cover ArcGrid ASCII file is vectorized into a polygon vector layer at 10% cover interval.
  1. Start Global Mapper. Load in a grid layer e.g. Cov.asc


  2. Select ALT+C.

    The Overlay Control Center is displayed
    .
  3. In the Overlay Control Center, mouse right click on the grid layer.

    A pop up menu appears.

  4. Choose Create Area Features from Equal Values in Selected Layer.

    The Setup Equal Value Area Creation dialog box appears.

  5. Optional. Change the Layer Description, Value Attribute Name, or Area Classification.
  6. In the Maximum Match Distance field, type in a value e.g. 0.05.

    Note: The example grid layer cell values are actually in %, even though the screenshot shows meters. It's just that Global Mapper assumes all grid layers are elevation related layers.
  7. Click OK.

    The vector polygons are generated.


Monday, June 27, 2011

Create a grid tile layout using Global Mapper

A region of interest may cover a large area. The file sizes of Geospatial data such as LiDAR or aerial photographs acquired over the entire region of interest will obviously be too large to be stored as a single physical file. In order to work with the data, geographers will have to cut the data into manageable tiles. For this purpose, a grid tile layout with some sort of naming scheme and dimensions will have to be designed and created.

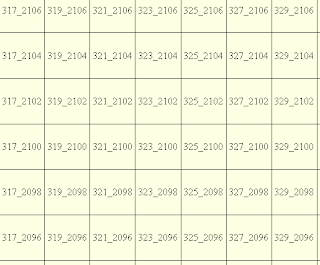
An example of a tile layout is shown below. In this example, the tiles are named according to the lower left coordinates i.e. X_Y, where X = x coordinate divided by 1000 and Y = y coordinate divided by 1000; and a tile has a width of 2000 meters and a height of 2000 meters.

Global Mapper can be used to create the grid tile layout from a region of interest polygon.
  1. Start Global Mapper. Load and display the region of interest polygon.
  2. Press ALT+C to display the Overlay Control Center.

  3. In the Overlay Control Center, select the region of interest layer. Click Metadata.

    The Metadata dialog box appears.

  4. Take note of the UPPER LEFT X, UPPER LEFT Y, LOWER RIGHT X, and LOWER RIGHT Y attributes.
  5. Since the UPPER LEFT X value is 305458, an appropriate grid origin x value would be 305000, i.e. a round down.
  6. Since the UPPER LEFT Y value is 2119255, an appropriate grid origin y value would be 2120000, i.e. a round up.
  7. Since the difference between the LOWER RIGHT X and UPPER LEFT X is 55326 (360784 - 305458), then an appropriate number of grid columns would be 28, i.e. 55326/2000 where 2000 is the grid width.
  8. Since the difference between the UPPER LEFT Y and LOWER RIGHT Y is 41187 (2119255 - 2078068), then an appropriate number of grid rows would be 21, i.e. 41187/2000 where 2000 is the grid height.
  9. Close the Metadata dialog box.
  10. Select ALT+D. Click the Create Regular Grid of Features  icon.

    The status bar shows the message "Left Click to Select Grid Anchor Point, ...".
  11. Click a point anywhere inside the map window.

    The Grid Setup dialog box appears.

  12. In the Number of Grid Rows field, type in 21.
  13. In the Number of Grid Columns field, type in 28.
  14. In the Grid Cell Width field, type in 2000 meters.
  15. In the Grid Cell Height field, type in 2000 meters.
  16. Click Anchor Point.

    The Select Location dialog box appears.

  17. In the X Coordinate field, type in 305000.
  18. In the Y Coordinate field, type in 2120000.
  19. Click OK.
  20. Toggle on Separate Row/Column Letters or Numbers. Toggle on Numbers.
  21. In the Rows Start field, type in 2120. In the Rows Step field, type in -2.
  22. In the Columns Start field, type in 305. In the Columns Step field, type in 2.
  23. Toggle on Reverse Naming, Prepend 0, and Separate Rows and Columns with Underscore.

  24. Click OK.

    The grid tile layout is created.

Monday, June 20, 2011

Graphically locate the lowest and highest DEM points in Global Mapper

Global Mapper 12 has a function to find the extreme elevation values in a digital elevation model (DEM) layer. It can only create a text file reporting on the lowest and highest elevations in a layer including the coordinates. If I want to locate the points on the map, then I will have to open up the text file and try to locate the points manually on the map. I found an alternative way to find the highest and lowest elevation points within a polygon graphically. It involves a bit of work as described below.
  1. Run Global Mapper. Load in a DEM file e.g. ground.asc.

  2. Press ALT+C to display the Control Center.
  3. In the Overlay Control Center, mouse right click on the DEM layer.

    A pop up menu appears.
  4. Choose Create Point Features at Elevation Grid Cell Centers.

    A new point layer "ground.asc Points" is created.

  5. Load in or create a polygon to define the area of interest for analysis.

  6. In the Overlay Control Center, toggle off the DEM e.g. ground.asc and the derivate point layer e.g ground.asc Points.
  7. Press ALT+D. Mouse left click on the polygon.

    The polygon is selected.
  8. Mouse right click anywhere on a blank space on the map window.

    A pop up menu appears.
  9. Choose Advanced Selection Options | Select All Point Features   within the Selected Area(s).

    The points inside the polygon are selected.
  10. Mouse right click on a blank space in the map window.

    A pop up menu appears.
  11. Choose Edit Selected Features.

    The Modify Selected Point Features dialog box appears.
  12. In the Feature Layer combo box, choose Create New Layer for Feature. Click OK.

    The Enter Layer Name dialog box appears.
  13. Type in a new layer name e.g. aoi. Click OK.

    The selected points are moved to their own layer.
  14. In the Overlay Control Center dialog box ,toggle off all the layers except the newly create layer aoi.

  15. Select Search | Search by Attributes, Names and Description.

    The Search Vector Data dialog box appears.
  16. Click the ELEVATION column header.

    The ELEVATION column is sorted in ascending order or descending order.
  17. Click on the lowest elevation record in the list to highlight the corresponding lowest elevation in the polygon on the terrain, and vice verse for the highest elevation.

    The location on the map is highlighted.

Monday, June 13, 2011

GeoMedia C# code snippet to connect to a WMS server

Recently I was asked to look at some C# code to connect and display a feature from a Web Mapping Service (WMS) server. I wrote some driving GeoMedia code to test out the connection.


//...cut...

//Create the connection to the WMS server
PClient.Connection conn = null;    //connection to the WMS server
MapviewLib.GMMapView map = (MapviewLib.GMMapView) mapWindow.MapView;
conn = (PClient.Connection) this.Application.CreateService("GeoMedia.Connection");
conn.Name = "WMS";
conn.Type = "WMS.GDatabase";
conn.Mode = 0;
conn.Description = "WMS";
conn.Location = "Not used";
conn.ConnectInfo = @"NOCSFFOUND=FAIL;URI=http://some.wms.com/wms.aspx";
conn.Connect();

//Now create a recordset to a WMS feature
PClient.OriginatingPipe OP;
conn.CreateOriginatingPipe(out OP);
OP.Table = "Feature1";

//Build a transformation path to/fro the map view coordinate system and the WMS and store the paths in the map view's CoordSystemsMgr object
PCSS.CoordSystem objCS = null;
PClient.ServerTransService objSTS = (PClient.ServerTransService)this.Application.CreateService("GeoMedia.ServerTransService");
PCSS.AltCoordSystemPath objAltCoordSystemPath = null;
PClient.GField objGeomFld = OP.OutputRecordset.GFields["Geometry"];
objSTS.CreateCSFromGeometryField( objGeomFld, out objCS);
objSTS.CreateSimpleTransFromCSMtoCS(map.CoordSystemsMgr, objCS, out objAltCoordSystemPath);

//Transform the WMS recordset to the map view's coordinate system
PDBPipe.CSSTransformPipe objXPipe = (PDBPipe.CSSTransformPipe)this.Application.CreateService("GeoMedia.CSSTransformPipe");
objXPipe.InputRecordset = (PDBPipe.GRecordset) OP.OutputRecordset;
objXPipe.InputGeometryFieldName = "Geometry";
objXPipe.CoordSystemsMgr = map.CoordSystemsMgr;
objXPipe.OutputCSGUID = map.CoordSystemsMgr.CoordSystem.GUID;

//Now we can use the transformed WMS recordset
PDBPipe.GRecordset wmsRS = objXPipe.OutputRecordset

//...etc...