Monday, July 7, 2014

Merge SpatiaLite polygon geometries with the GUnion operator in QGIS

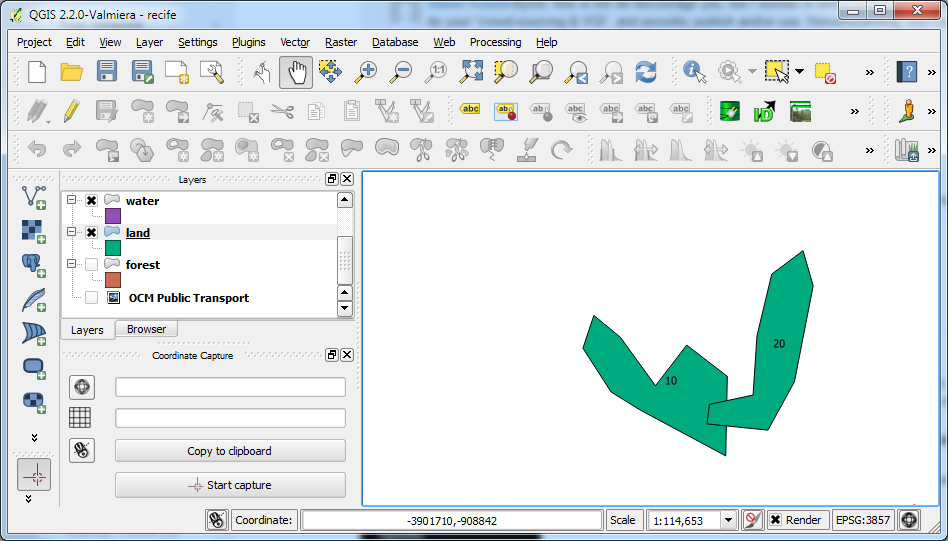
I wanted to merge two polygon geometries in a SpatiaLite database (an example is the land feature layer shown in the screenshot below) into a single geometry using QGIS.
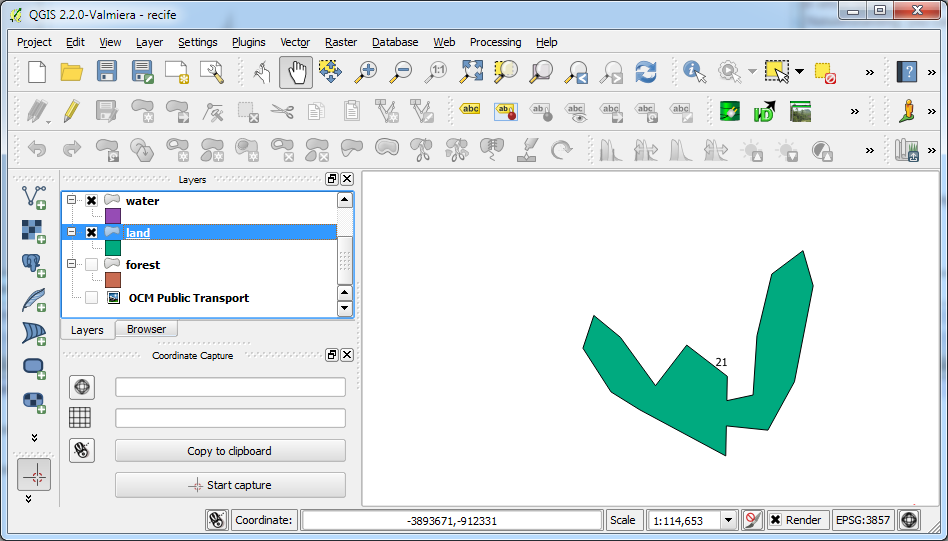
Two SpatiaLite polygons labelled with the primary key id number.
In QGIS, the usual command to perform this task is the Union command, but unfortunately it creates only Shapefiles. The alternative is to use the QSpatiaLite plug-in and run some SQL commands to do the job. The following steps show how to merge two polygons into one polygon using the SpatiaLite GUnion operator.

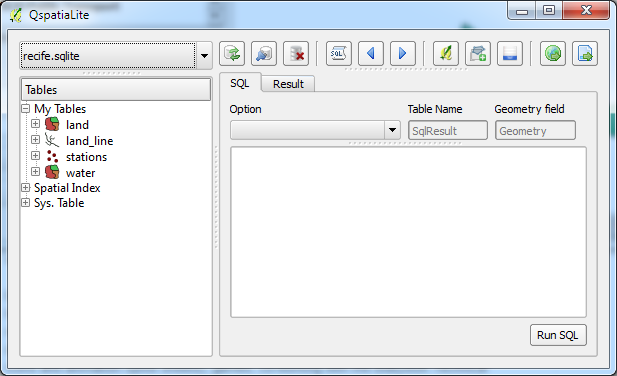
  1. In QGIS, select Database | SpatiaLite | QSpatiaLite.

    The QSpatiaLite dialog box appears.
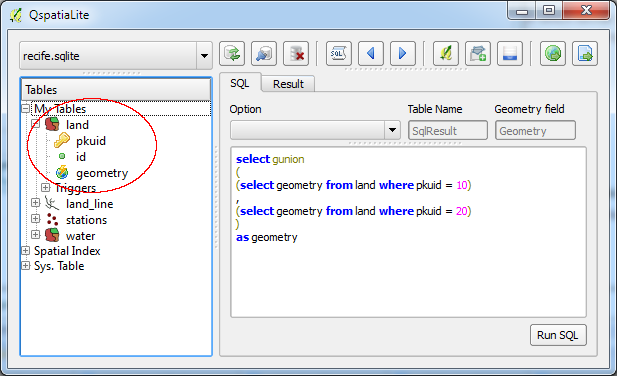
  2. Note down the primary key numbers or any suitable identifier of the polygons to be merged, e.g. pkuid 10 and 20.
  3. In the SQL tab field, type in the SQL command.

    SELECT GUNION
    (
    (SELECT geometry FROM land WHERE pkuid = 10)
    ,
    (SELECT geometry FROM land WHERE pkuid = 20)
    )
    AS geometry


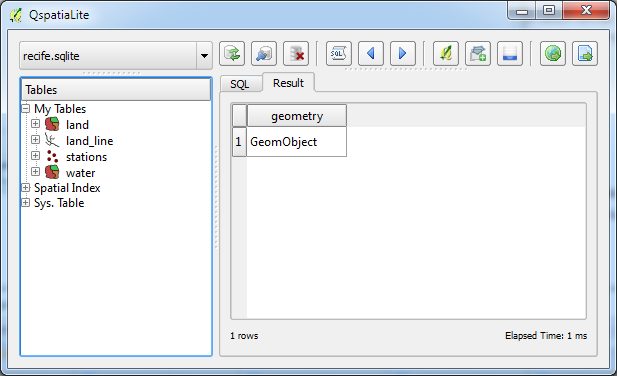
  4. Click Run SQL.

    A temporary new geometry object is created.


    Note: if the above SQL command execution is successful, then it is fine to proceed to create a new merged polygon feature and delete the original two polygons.
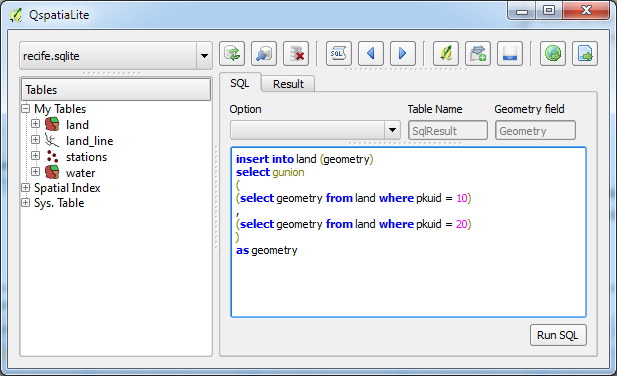
  5. In the SQL tab, type in the following SQL command to create and insert a merged polygon feature record.

    INSERT INTO land (geometry)
    SELECT GUNION
    (
    (SELECT geometry FROM land WHERE pkuid = 10)
    ,
    (SELECT geometry FROM land WHERE pkuid = 20)
    )
    AS geometry

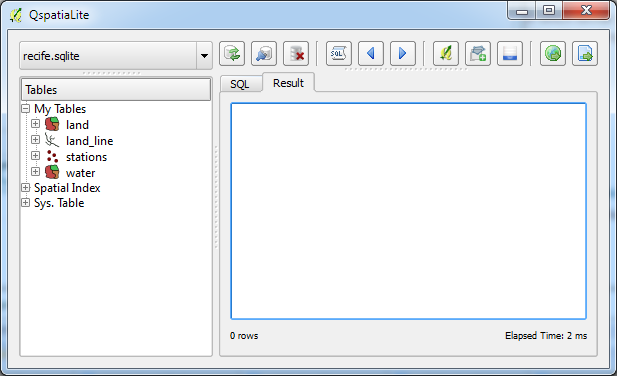
  6.  Click Run SQL.

    A new row is inserted into the land table.
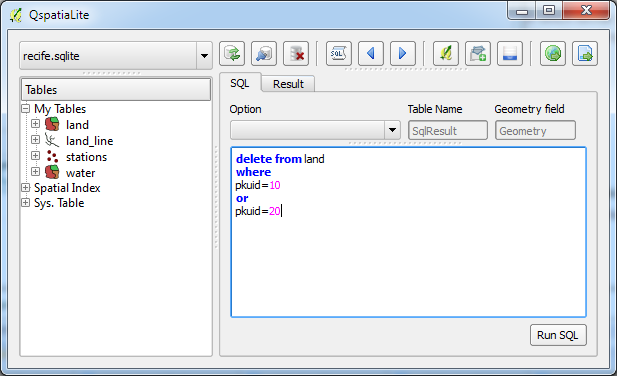
  7. In the SQL tab, type in the SQL command to delete the original two polygon features.

    DELETE FROM land WHERE pkuid = 10 OR pkuid = 20

  8. Click Run SQL.

    The original polygon features are deleted.
  9. Refresh the map view by toggling the land feature display off and on.

    The merged polygon is displayed.

Monday, June 30, 2014

Trainsity Fortaleza Metro Android App

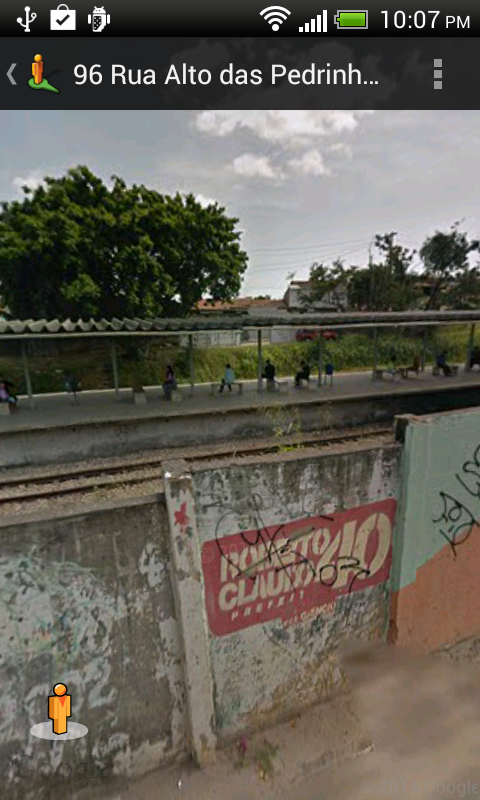
Find your way around the city of Fortaleza, Brazil using the high resolution vector maps of the MetroFor's West and South Lines. The maps have small file sizes and they can be zoomed in many times without becoming blur or blocky, and they can be displayed without an Internet connection. Users can tap the train station labels to open Google Maps or Street View, where they can use all the functions of the Google apps to visualize the surrounding area and/or perform routing for directions.

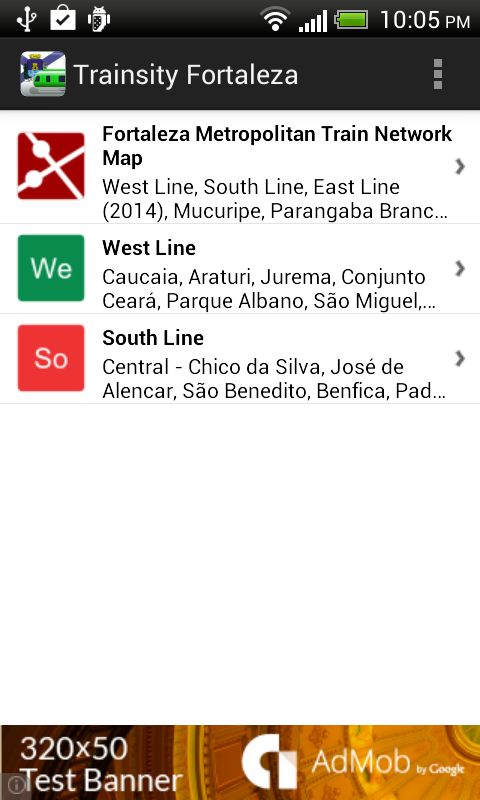
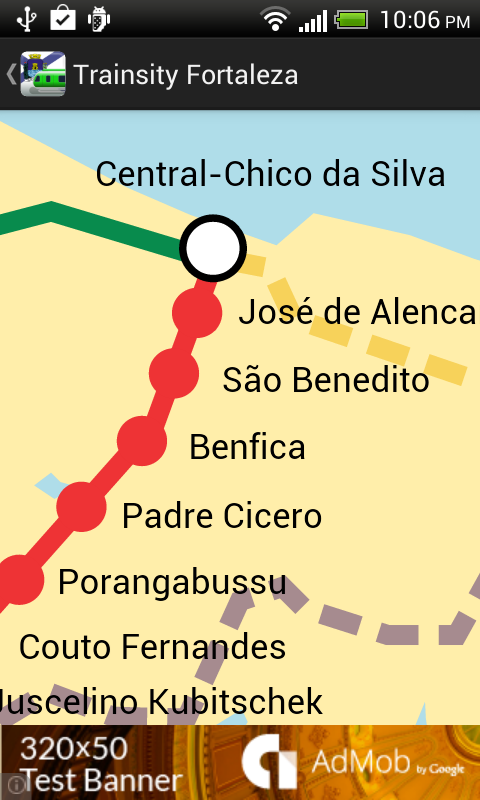
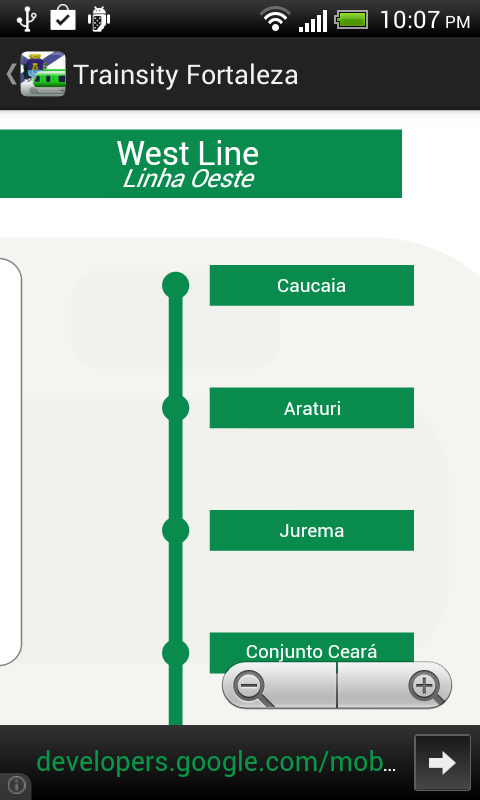
On a mobile handset, the app will display a list of train lines, which when tapped will open up a detail view of the metro transit map, as shown below.

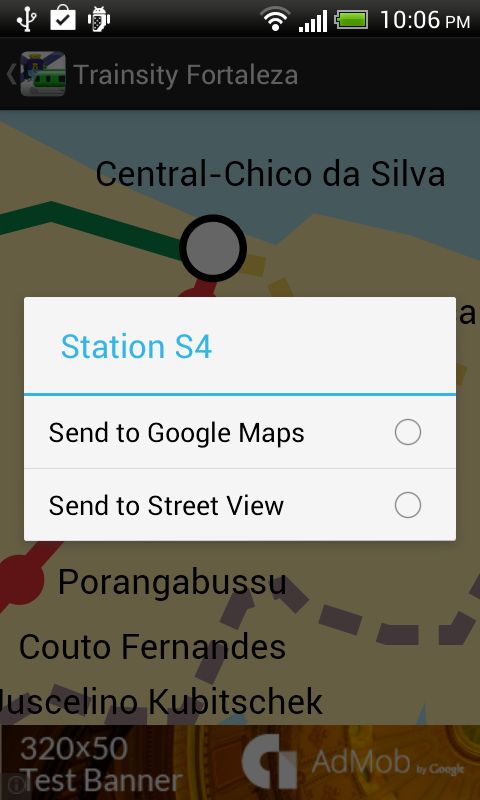
Tapping the station boxes will bring up an option menu where users can choose to display the station in Google Maps or Street View.


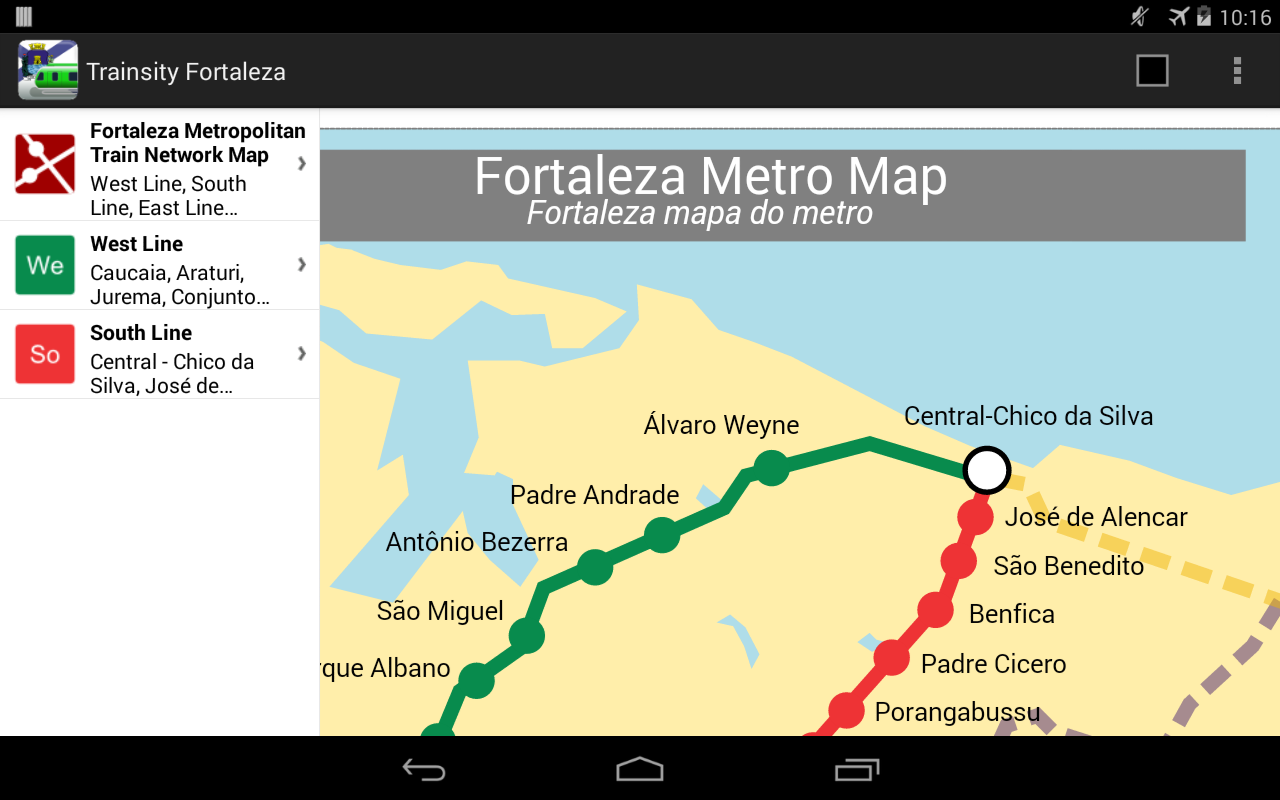
The app is also optimized for tablet devices. The layout on a tablet will show both the list and the vector map at the same time, as shown below.


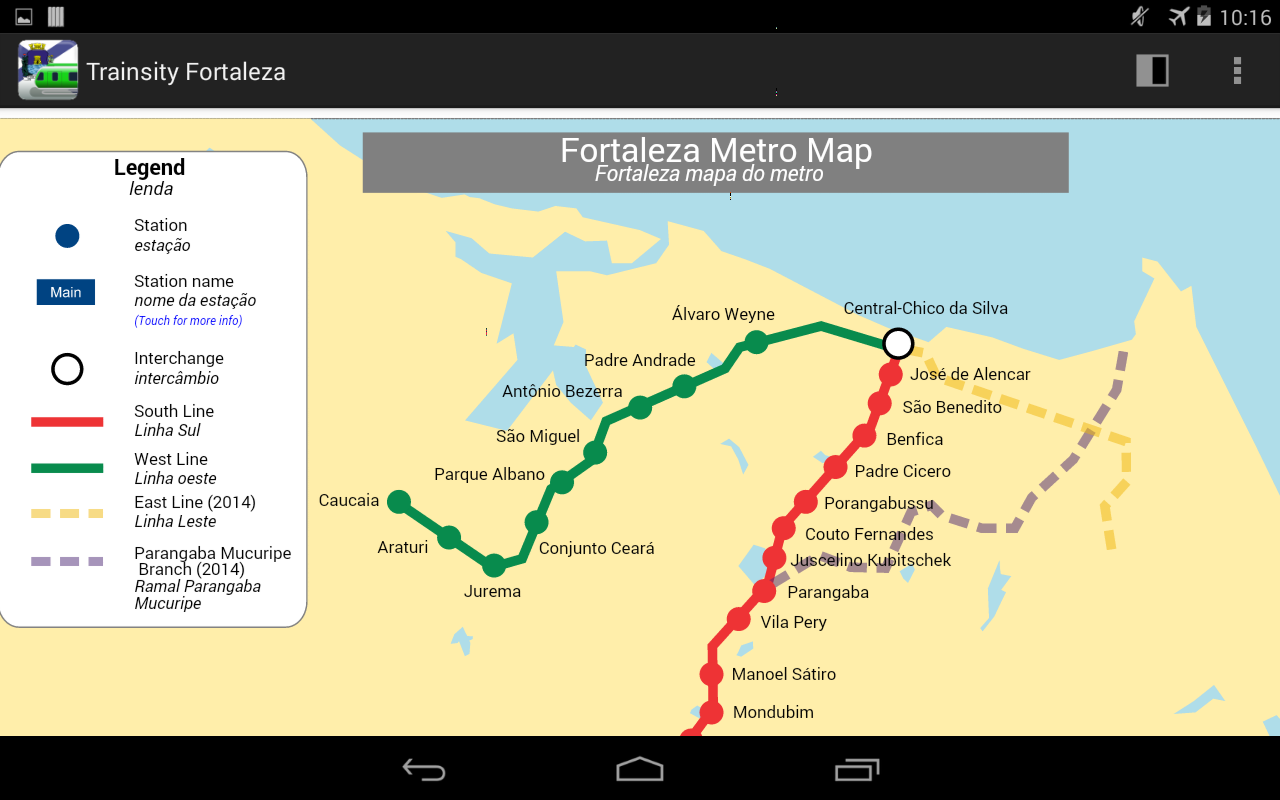
Users can toggle the map to full screen by tapping the action bar icon at the top right.

The app is available on the Google Play Store. Just click the button below.
Get it on Google Play

Monday, June 23, 2014

Change the dynamic rubber band display of features being digitized in QGIS

While digitizing new polygon features in QGIS, I found that the dynamic display of the new polygon to obscure other map layers that could aid in the digitizing work. As an example, see the screenshot below: the polygon being digitized is displayed in (almost) opaque red color fill that the features below is almost obscured.

There is a setting in QGIS that controls the color and opacity of the dynamic digitizing display.

To change the dynamic display properties do the following.

  1. Select Settings | Options in the application's menu.

    The Options | Digitizing dialog box appears.

  2. In the Rubber band field, click on the highlighted area (shown in red circle below).

    Note: There is a problem in QGIS 2.2.0 with showing the rubberband color - none is displayed, as shown in the highlighted area of the screen shot above.

    The Select Color dialog box appears.

  3. Optional. Choose another color, e.g. purple.
  4. In the Alpha channel field, type in another value e.g. 80. Click OK.

    Note: type in 255 for a fully opaque rubber band and 0 for a fully transparent rubber band.
  5. Click OK to close the Options | Digitizing dialog box.
  6. To see the effect, start to digitize another polygon.

Monday, June 16, 2014

Trainsity Rio de Janeiro Metro Android App


This is another Android App inspired by the on-going FIFA World Cup 2014 in Brazil. Using this, find the way around the city of Rio de Janeiro using the high resolution vector maps of the MetroRio's Orange Line 1Green Line 2 and the Subway Bus lines. The maps have small file sizes but high resolution which will not become "blocky" pixels when zoomed in. They can be viewed offline without an Internet connection. Users can tap the train station labels to open Google Maps or Street View, where they can use all the functions of the Google apps to visualize the surrounding area and/or perform routing for directions.

On a mobile handset, the app will display a list of train lines, which when tapped will open up a detail view of the metro transit map, as shown below. 
Tapping the station boxes will bring up an option menu where users can choose to display the station in Google Maps or Street View.
The app is also optimized for tablet devices. The layout on a table will display both the list and the vector map at the same time, as shown below.
Users can toggle the map to full screen mode by tapping the action bar icon at the top right corner.
The app is available on the Google Play Store. Just click the button below.
Get it on Google Play

Monday, June 9, 2014

Using QGIS' Reshape Features command to edit polygons

I found the Reshape Features command in QGIS useful to manipulate the shape of polygons. The command can add to or subtract from the shape of the polygon depending on the location of the first and last vertices placed with the command. The following examples illustrate this.

To subtract from the shape of the polygon

  1. Select a polygon layer, e.g. waterbody. Select Layer | Toggle Editing.

    The layer is selected for editing.
  2. In the Advanced Editing tool bar, select the Reshape Features icon.
  3. In the map view, click on one point outside the polygon (point 1). Click on one or more points inside the polygon (point 2... point 3). Click on a point outside the polygon (point 4).

  4. Press the mouse right button to complete the action.

    The newly digitized polygon is subtracted from the original polygon.
To add to the polygon shape
  1. Select a polygon layer, e.g. waterbody. Select Layer | Toggle Editing.

    The layer is selected for editing.
  2. In the Advanced Editing tool bar, select the Reshape Features icon.
  3. In the Map view, click on one point inside the polygon (point 1). Click on one or more points outside the polygon (point 2...point 3). Click on a point inside the polygon (point 4).

  4. Press the mouse right button to complete the action.

    The newly digitized polygon is added to the original polygon.

Monday, June 2, 2014

Trainsity Brasilia Android App

This app was created just in time for the FIFA World Cup 2014 in Brazil. Use this to find your way around the city of Brasilia using the high resolution vector maps of the metro Green and Orange Lines. The vector maps have small file sizes and can be zoomed in many times without any appearance of pixels, unlike raster based maps. The maps can also be viewed offline without any Internet connection. The station labels on the maps can be tapped to open up either the Google Maps or Street View apps - in which users can further visualize the surrounding  area and perform direction queries.

On a mobile handset, users will initially see a list of train maps. When a line is tapped, the detail map view of the metro line will appear, as shown below.

Tapping the station labels/boxes will bring up an option menu where users can choose to display the station in Google Maps or Street View.

On a tablet device, both the list and the map are displayed at the same time, as shown below.

Users can toggle the map to full screen mode by tapping the action bar icon at the top right corner.


You can download this app from the Google Play Store by clicking the badge below.

Get it on Google Play

Monday, May 26, 2014

QGIS Export layers to SVG for cartographic editing in desktop publishing software

If there is a need to manipulate QGIS map layers for cartographic publishing purposes in vector editing software like Adobe Illustrator or the free and open source software Inkscape, there is a plugin - Simple SVG for that. The plugin is not perfect but it gives you probably enough to work on.

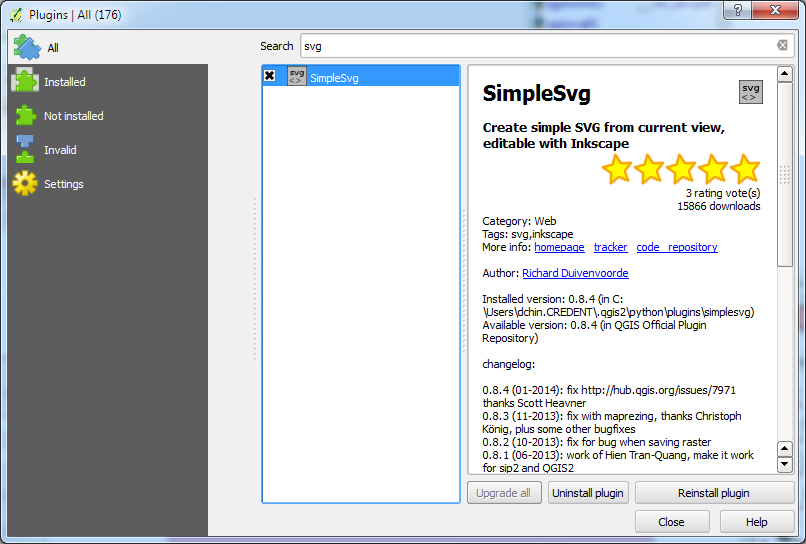
If the plugin is not installed in QGIS, simply run select Plugins | Manage and install Plugins... Then search for SimpleSvg, as shown below. Once located, just install it. There will be a Web pull down menu and an SVG icon in the tool bar.

  1. Using SimpleSvg is simple. Just display the layers you want to export to SVG. Resize the map view until you are happy with the extent.


  2. Then select Web | Save as SVG | Save as SVG.

    The SimpleSvg dialog box appears.

  3. Type in the output SVG file path and name.

    Note: On Windows, clicking the browse button will cause a Python error. So just key in the output file path and name.

  4. Click OK.

    The SVG file is created.

  5. Open the resultant SVG file in a vector editing software such as Inkscape. Further cartographic editing can now be done on the resultant vector graphics.


    Note: There is a bounding box feature in the resultant layer named qgisviewbox.
    Each map feature is placed in its own layer, e.g. waterbody.
    Each map feature is grouped together
    .