Monday, May 28, 2012

Google Mapplet for showing local coordinates

This Google Mapplet was written to show the local projected coordinates for any clicked point on Google Maps. Run it from this website http://dominoc925-pages.appspot.com/mapplets/cs_readout.html.


The mapplet currently supports only the following projection types: Cassini-Soldner, Mercator, Oblique Mercator and Transverse Mercator. The datum transformation between the WGS84 datum used by Google Maps and the local projection datum is done using the Standard Molodensky transformation. The transformation parameters of the datums and ellipsoid parameters are taken from this University of Colorado site http://www.colorado.edu/geography/gcraft/notes/datum/edlist.html.

Define and save projection parameters
There are probably hundreds of projection parameter sets in use in the world - too many to keep track. A facility has been built in using some HTML5 features to allow projection parameters to be changed, saved and named, and reuse in the current browser.


  1. In the Side bar on the right, click the Projection link.
  2. In the Projection combo box, select any default projection parameter set e.g. British National Grid.
  3. Change any parameters e.g. Longitude of origin.
  4. Click Save projection as.

    A text entry field appears.
  5. Type in a meaningful name e.g. MyProjection. Click Ok.

    The projection parameters are saved and named as MyProjection.
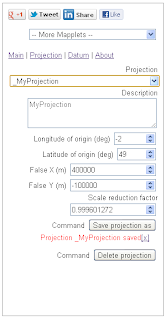
    Simply select the saved projection to use it for the coordinate readout. 

Monday, May 21, 2012

Adjust brightness and contrast of intensity images using Imagemagick

Sometimes the intensity images generated from LiDAR las files are too dark or too bright. An example of a dark intensity image is shown below.

It is useful to be able to apply some post-processing brightness and contrast adjustments to the images. Photoshop can be used to interactively adjust the brightness and contrast but I like to use the free Imagemagick open source software to process images in batch. Imagemagick has a convert utility which can perform brightness and contrast adjustments on images from the command line.

To make an intensity image brighter, type in the following at the command line prompt with the brightness-contrast option.
c:\> convert -brightness-contrast 50x20 input.tif out_lighter.tif

where the 50 tells the utility to increase the brightness by +50 and 20 is to increase the contrast by 20.


To make an intensity image darker, type in the following at the command line prompt with negative brightness and/or contrast values.
c:\> convert -brightness-contrast -30x10 input.tif out_darker.tif

where -30 is to darken by 30 and +10 is to increase the contrast by 10.

More information about the convert utility is available on this link.

Monday, May 14, 2012

Re-align a raster image to the corners in Gimp

The free and open source software Gimp is an Adobe Photoshop like software that can be used to edit or adjust raster images. If you use the Gimp software for editing raster images for contrast, brightness, color balance, etc. then it just might be possible to make a mistake and shift the entire raster image layer so that it is no longer align to the canvas corners. The screenshot below shows a shaded relief raster image that has been mistakenly shifted - the bottom right is no longer aligned to the corner.

In order to shift the raster layer back precisely, the Gimp ruler guide lines can be used as described below.

  1. In the Gimp Toolbox, click the Zoom tool and zoom closer to the corner.


  2. On the top horizontal ruler bar, press down the left mouse button and drag out a horizontal guide line until it snaps to the bottom of the canvas.


  3. On  the left vertical ruler bar, press down the left mouse button and drag out a vertical guide line until it snaps to the right of the canvas.
  4. In the Toolbox, click the Move tool. Press down the left mouse button on the raster image and drag the image so that the bottom right corner snaps  to the horizontal and vertical guide lines.

    The raster image is snapped to the canvas corner.


    The raster image is now correctly aligned again.
     

Monday, May 7, 2012

How to detect changes between two GeoMedia polygon features

Detecting changes between two polygon vector features is a common workflow in GIS especially for forestry, and land use planning. For example, it may be useful to quantify the amount of forest cover changes (loss of vegetation, or vegetation growth) between two periods of time. GeoMedia provides the spatial analysis functions that can help to detect the changes provided the polygon vegetation features for the two periods of time are available. The example below illustrates how to use GeoMedia's Spatial Difference command to identify the loss of vegetation and vegetation growth.


Identify the loss of vegetation

  1. In GeoMedia, select Analysis | Spatial Difference.

    The Spatial Difference dialog box appears.

  2. In the From features in combo box, select the later vegetation polygon feature e.g. Vegetation2012.
  3. In the Subtract features in combo box, select the earlier vegetation polygon feature e.g. Vegetation2002.
  4. In the Output difference as Query name field, type in a meaningful string e.g. Loss of Vegetation since 2002.
  5. Optional. Click the Style button and set a thick border color e.g. red.
  6. Click OK.

    The areas representing the loss of vegetation since 2002 are displayed in red.

Identify the new vegetation growth
  1. Select Analysis | Spatial Difference.

    The Spatial Difference dialog box appears.

  2. In the From features in combo box, select the later vegetation polygon feature e.g. Vegetation2012.
  3. In the Subtract features in combo box, select the earlier vegetation polygon feature e.g. Vegetation2002.
  4. In the Output differences as Query name field, type in a meaningful string e.g. New vegetation growth since 2002.
  5. Optional. Click Style and set a thick green border color.
  6. Click OK.

    The new vegetation growth areas are displayed in dark green.
     

Monday, April 30, 2012

Google Mapplet for showing MGRS coordinates

The Military Grid Reference System (MGRS) is a worldwide standard based on Universal Transverse Mercator (UTM) used by NATO to locate points on the earth. More information about MGRS can be found in the Wikipedia. 


You can use this mapplet to display the MGRS coordinates for any point on Google Maps. Simply click on any location on Google Maps. Just adjust the Readout Digits to matched the desired MGRS Coordinate accuracy. 

Alternatively, you can type in an MGRS coordinate in the side bar e.g. 32SMG0329. Then click the Locate point on map button to display the MGRS coordinate on Google Maps. 


The default datum used is WGS84. If a different datum is desired, then simple click Datum and select another datum e.g. WGS72. 


Go to this site http://dominoc925-pages.appspot.com/mapplets/cs_mgrs.html to run the mapplet.

Tuesday, April 24, 2012

Example of using gvSIG'S Modeler

gvSIG's Modeler function can be used to create reusable models of processes that can be applied on geographical vector and raster data layers. For example, if you need to periodically generate centroids and calculate the centroid coordinates from polygon vector layers, then it may be worthwhile to use the Modeler. Once you have a model of the processes created, it is a simple matter to reload the model and run it.

The models are almost similar to programming scripts except that you don't need to be a developer to create them. You simply use a graphical user interface to point and click to define the model. The example below shows how easy it is to create the model with the Modeler.

Create a New Model

  1. Start gvSIG OADE 2010. Load and display a vector polygon layer e.g. C:\data\States.shp.

  2. Click the Modeler   icon in the tool bar.

    The Modeler dialog box appears.
  3. In the Inputs tree, double click on Vector layer.

    A dialog box appears.
  4. In the combo box, choose Polygons. Click OK.

    The Vector layer1 icon appears in the Modeler dialog box.
  5. Click the Procedures tab. Under the Procedures | Algorithms tree, expand the Tools for polygon layers node. Double click Centroids.

    A dialog box pops up.
  6. Click OK.

    A Centroids icon appears connected to the Vector layer1 icon in the Modeler dialog box.
  7. Under the Procedures | Algorithms tree, expand the Tools for point layers node. Double click Add coordinates to points.

    A dialog box appears.


  8. Toggle on Keep as final result.
  9. Optional. In the Name field, type in the output point layer name.
  10. Click OK.

    The Add coordinates to points icon is displayed connected to the Centroids icon in the Modeler dialog box.

    Note: To save the model, click Save and specify the output file path and name. 
Running a Model
  1. Click Run.

    The [Model] dialog box appears.
  2. In the Inputs Vector layer field, choose a polygon layer e.g. States.shp.
  3. Optional. In the Outputs field, type in a new output Shape file path and name.
  4. Click OK.

    The processes defined by the model is executed and the output layer(s) is created.
  5. Close the Run model dialog box.
  6. Optional. To review the centroid point coordinates, select the newly created layer in the legend and choose Layer | Show attribute table.

    The attribute table appears as shown below. Note the two newly created X and Y attribute fields.

Monday, April 16, 2012

Show Geographic Grid Google Mapplet

I spent some time to put together this Google Mapplet that simply shows the latitude and longitude geographic grid lines and labels on Google Maps. The grid lines and labels will display and adjust themselves dynamically as you zoom in and out; from every few degrees until every second.

The screenshot below shows the grid lines and labels at the finest 1 second resolution.


To run this mapplet, just go to the site http://dominoc925-pages.appspot.com/mapplets/gridgeo.htm.